Home /
Expert Answers /
Economics /
use-the-diagram-to-describe-the-adjustment-process-when-the-labour-market-is-at-point-y-nbsp-pa438
(Solved): use the diagram to describe the adjustment process when the labour market is at point y. ...
use the diagram to describe the adjustment process when the labour market is at point y.
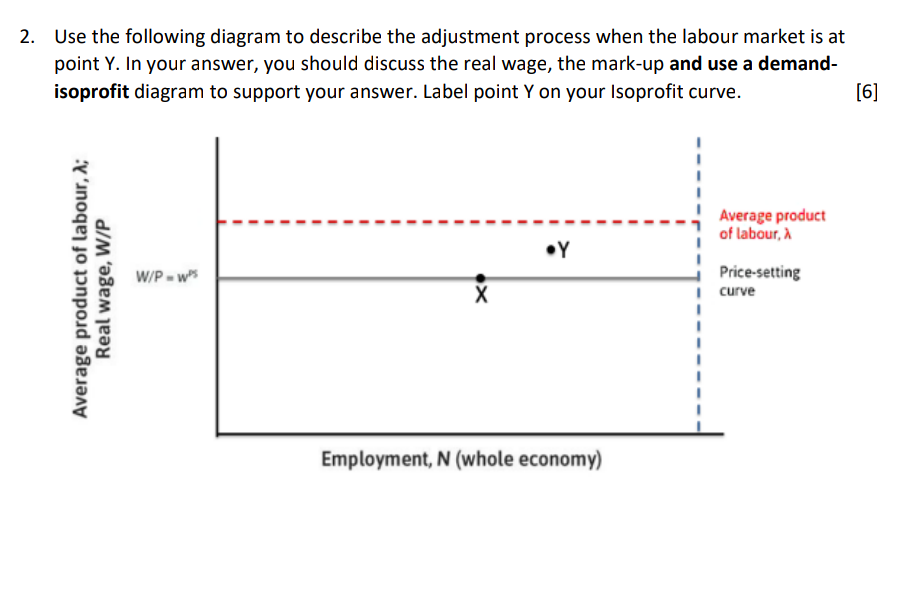
Use the following diagram to describe the adjustment process when the labour market is at point Y. In your answer, you should discuss the real wage, the mark-up and use a demandisoprofit diagram to support your answer. Label point \( Y \) on your Isoprofit curve. \( [6 \)