Home /
Expert Answers /
Statistics and Probability /
this-problem-is-designed-to-familiarize-you-with-basic-microsoft-excel-functions-that-are-commonly-pa744
(Solved): This problem is designed to familiarize you with basic Microsoft Excel functions that are commonly ...
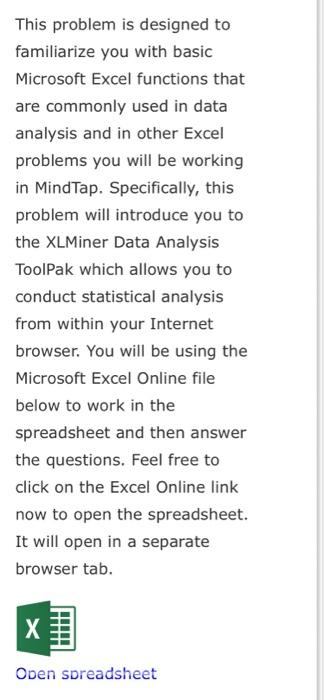
This problem is designed to familiarize you with basic Microsoft Excel functions that are commonly used in data analysis and in other Excel problems you will be working in MindTap. Specifically, this problem will introduce you to the XLMiner Data Analysis ToolPak which allows you to conduct statistical analysis from within your Internet browser. You will be using the Microsoft Excel Online file below to work in the spreadsheet and then answer the questions. Feel free to click on the Excel Online link now to open the spreadsheet. It will open in a separate browser tab.
On the right side of the spreadsheet you will notice what is called a task pane add-in. The add-in for this file is the XLMiner Analysis ToolPak. If you are familiar with the Data Analysis Tool in desktop Excel, the add-in works in the exact same way. NOTE: If this your first time using the ToolPak you may need to give it permission to run in your browser. If you would like to learn more about a specific function, you can always visit the Microsoft Office Support site and type the function into the search box at the topright of the page. Searching for "data analysis" will return a guide for using the Data Analysis Tool / XLMiner Analysis ToolPak.
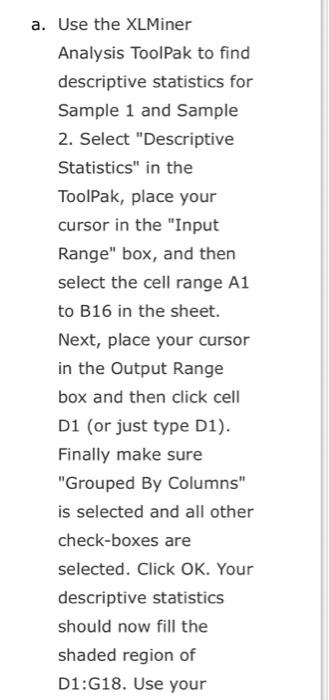
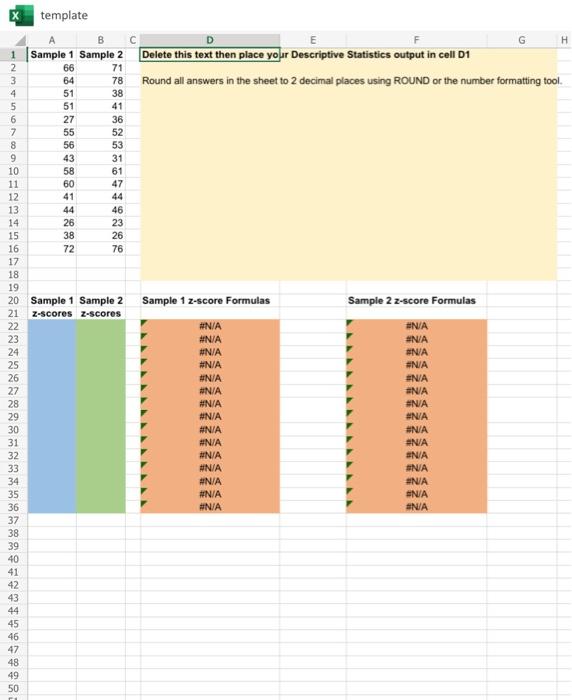
Use the XLMiner Analysis ToolPak to find descriptive statistics for Sample 1 and Sample 2. Select "Descriptive Statistics" in the ToolPak, place your cursor in the "Input Range" box, and then select the cell range \( \mathrm{A} 1 \) to B16 in the sheet. Next, place your cursor in the Output Range box and then click cell D1 (or just type D1). Finally make sure "Grouped By Columns" is selected and all other check-boxes are selected. Click OK. Your descriptive statistics should now fill the shaded region of D1:G18. Use your
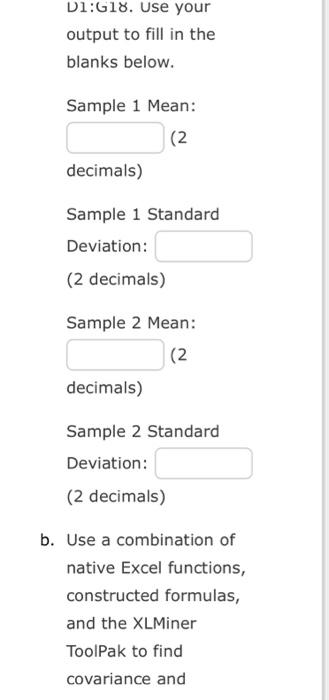
Dl:G18. Use your output to fill in the blanks below. Sample 1 Mean: decimals) Sample 1 Standard Deviation: (2 decimals) Sample 2 Mean: (2 decimals) Sample 2 Standard Deviation: (2 decimals) Use a combination of native Excel functions, constructed formulas, and the XLMiner ToolPak to find covariance and
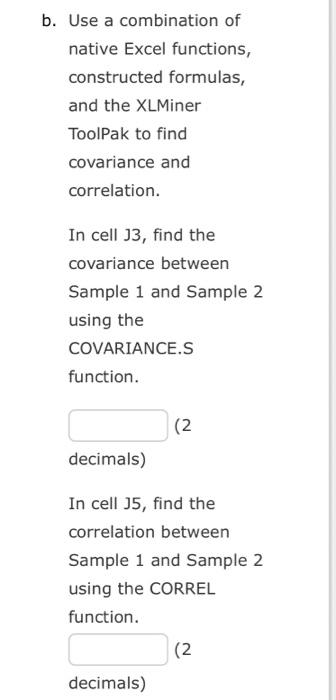
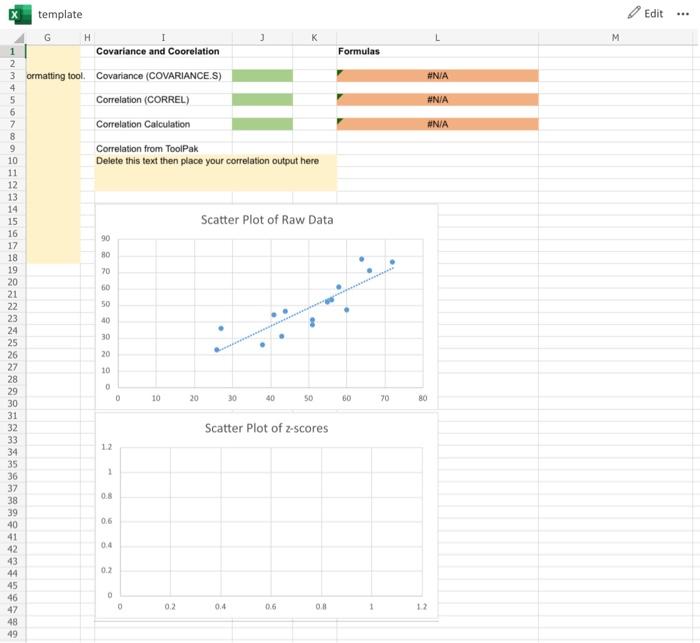
Use a combination of native Excel functions, constructed formulas, and the XLMiner ToolPak to find covariance and correlation. In cell J3, find the covariance between Sample 1 and Sample 2 using the COVARIANCE.S function. decimals) In cell J5, find the correlation between Sample 1 and Sample 2 using the CORREL function. 2 decimals)
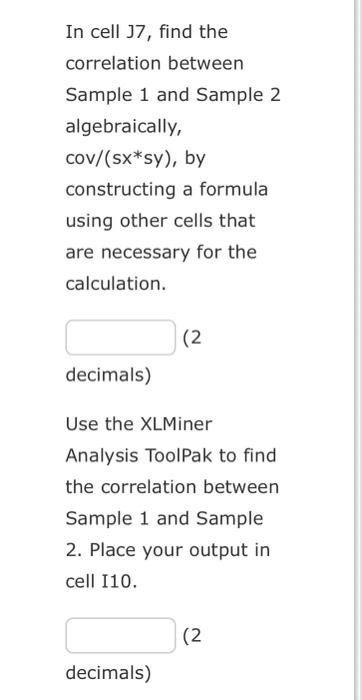
In cell J7, find the correlation between Sample 1 and Sample 2 algebraically, \( \operatorname{cov} /(\mathrm{sx} * \mathrm{sy}) \), by constructing a formula using other cells that are necessary for the calculation. ( decimals) Use the XLMiner Analysis ToolPak to find the correlation between Sample 1 and Sample 2. Place your output in cell I10. \( (2 \) decimals)
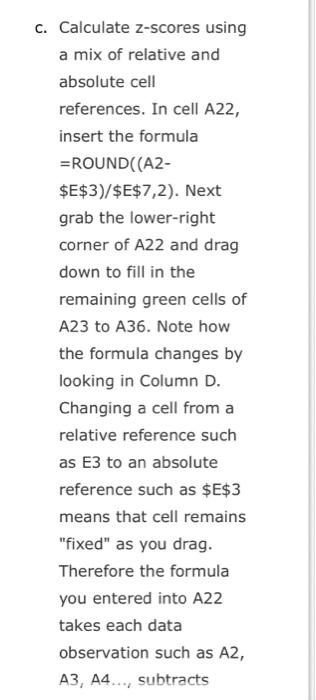
c. Calculate z-scores using a mix of relative and absolute cell references. In cell A22, insert the formula \( =\mathrm{ROUND}((\mathrm{A} 2 \) \$E\$3)/\$E\$7,2). Next grab the lower-right corner of A22 and drag down to fill in the remaining green cells of A23 to A36. Note how the formula changes by looking in Column D. Changing a cell from a relative reference such as E3 to an absolute reference such as \( \$ E \$ 3 \) means that cell remains "fixed" as you drag. Therefore the formula you entered into A22 takes each data observation such as \( \mathrm{A} 2 \), \( A 3, A 4 \ldots \), subtracts
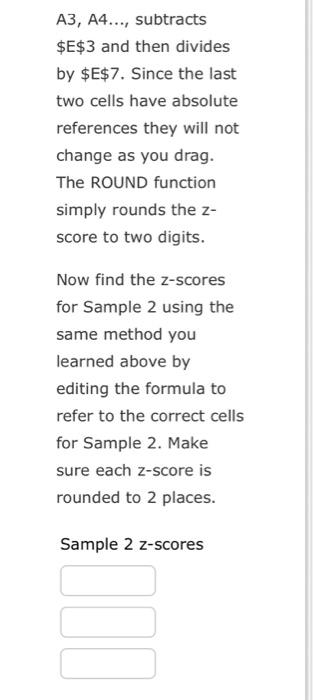
\( A 3, A 4 \ldots \), subtracts \$E \( \$ 3 \) and then divides by \( \$ E \$ 7 \). Since the last two cells have absolute references they will not change as you drag. The ROUND function simply rounds the \( z \) score to two digits. Now find the z-scores for Sample 2 using the same method you learned above by editing the formula to refer to the correct cells for Sample 2. Make sure each z-score is rounded to 2 places. Sample 2 z-scores
Sample 2 z-scores
template