Home /
Expert Answers /
Calculus /
the-velocity-of-a-car-accelarating-from-a-stop-light-is-shown-in-the-graph-below-use-the-graph-to-pa799
(Solved): The velocity of a car accelarating from a stop light is shown in the graph below. Use the graph to ...
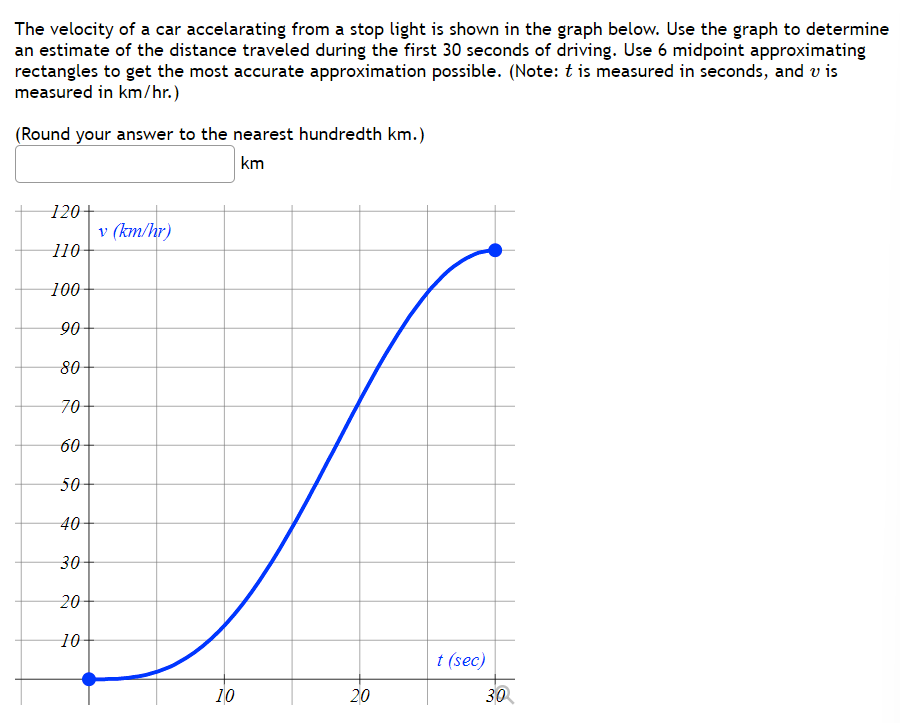
The velocity of a car accelarating from a stop light is shown in the graph below. Use the graph to determine an estimate of the distance traveled during the first 30 seconds of driving. Use 6 midpoint approximating rectangles to get the most accurate approximation possible. (Note: t is measured in seconds, and vis measured in km/hr.) (Round your answer to the nearest hundredth km.) km 120+ v (km/hr) H0 100 90 80 70 60 50 40 30 20 10 t (sec) 10 20 30