Home /
Expert Answers /
Earth Sciences /
the-two-maps-shown-are-pressure-maps-for-the-united-states-pressure-is-shown-in-millibars-the-t-pa446
(Solved): The two maps shown are pressure maps for the United States (pressure is shown in millibars). The t ...
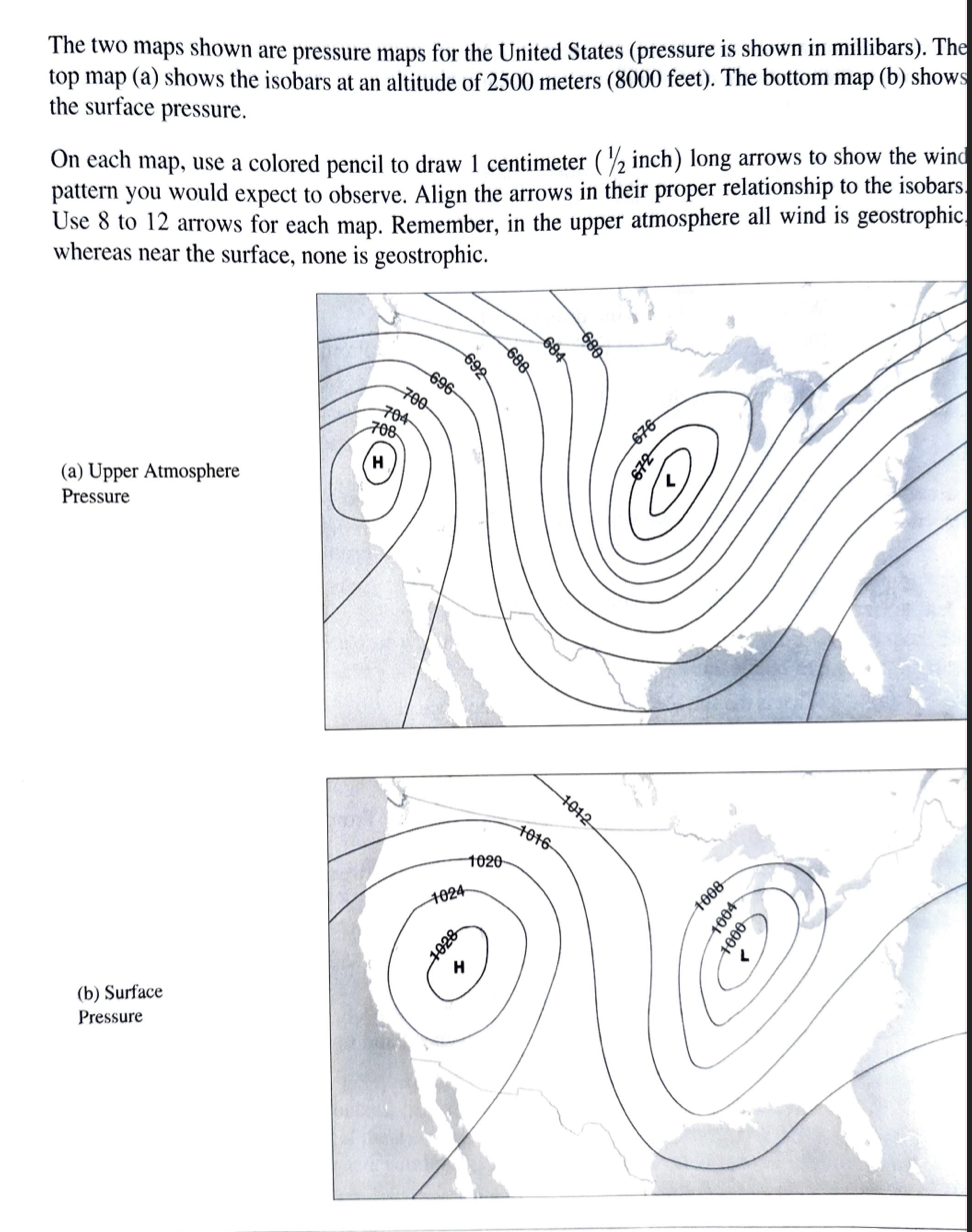
The two maps shown are pressure maps for the United States (pressure is shown in millibars). The top map (a) shows the isobars at an altitude of 2500 meters ( 8000 feet). The bottom map (b) shows the surface pressure. On each map, use a colored pencil to draw 1 centimeter ( \( 1 / 2 \) inch) long arrows to show the wind pattern you would expect to observe. Align the arrows in their proper relationship to the isobars. Use 8 to 12 arrows for each map. Remember, in the upper atmosphere all wind is geostrophic whereas near the surface, none is geostrophic. (a) Upper Atmosphere Pressure (b) Surface Pressure