Home /
Expert Answers /
Economics /
the-table-shows-the-demand-and-supply-schedules-for-bread-a-drought-in-wheat-growing-areas-decrea-pa803
(Solved): The table shows the demand and supply schedules for bread. A drought in wheat growing areas decrea ...
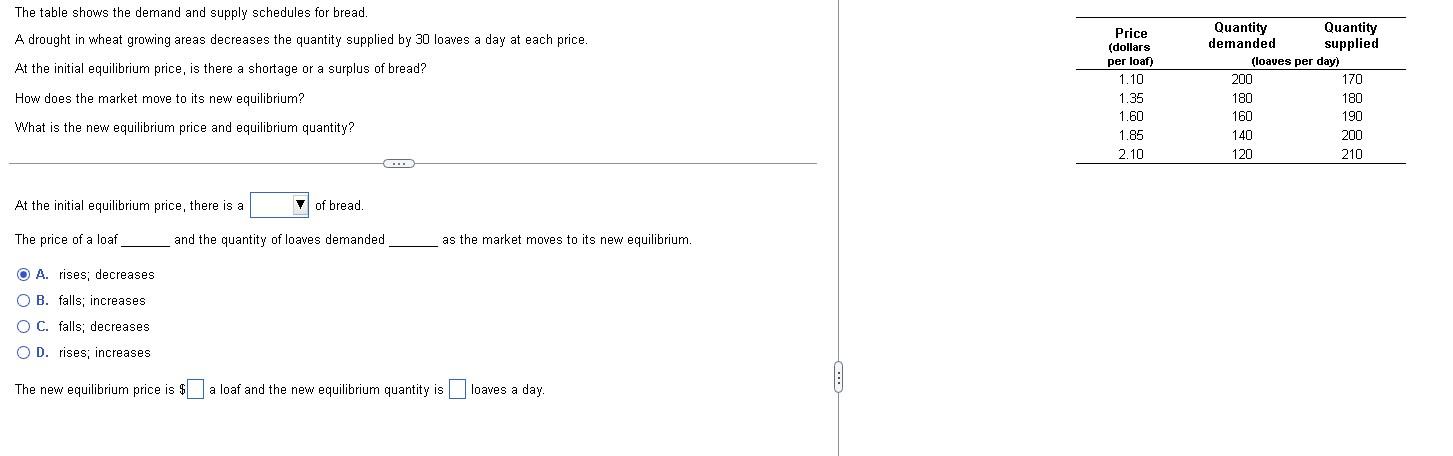
The table shows the demand and supply schedules for bread. A drought in wheat growing areas decreases the quantity supplied by 30 loaves a day at each price. At the initial equilibrium price, is there a shortage or a surplus of bread? How does the market move to its new equilibrium? What is the new equilibrium price and equilibrium quantity? At the initial equilibrium price, there is a of bread. The price of a loaf and the quantity of loaves demanded as the market moves to its new equilibrium. A. rises; decreases B. falls; increases C. falls; decreases D. rises; increases The new equilibrium price is \( \$ \) a loaf and the new equilibrium quantity is loaves a day.