Home /
Expert Answers /
Economics /
the-table-indicates-two-levels-of-real-gdp-for-an-economy-0-and-750-billion-and-pa578
(Solved): The table indicates two levels of real GDP for an economy, \( \$ 0 \) and \( \$ 750 \) billion, and ...
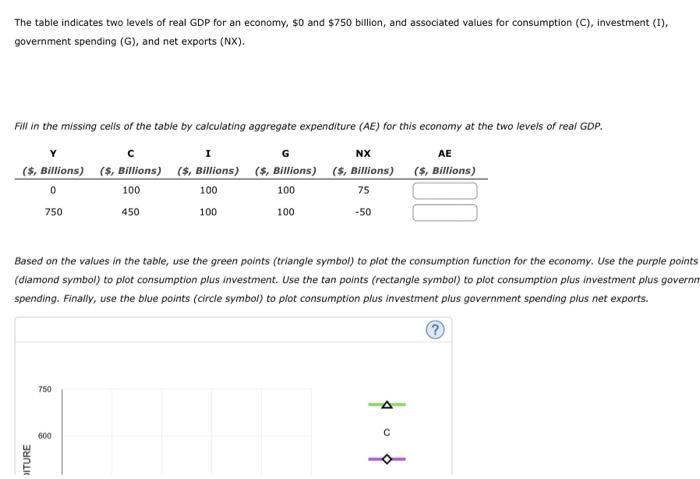
The table indicates two levels of real GDP for an economy, \( \$ 0 \) and \( \$ 750 \) billion, and associated values for consumption (C), investment (I), government spending (G), and net exports (NX). Fill in the missing cells of the table by calculating aggregate expenditure (AE) for this economy at the two levels of real GDP. Based on the values in the table, use the green points (triangle symbol) to plot the consumption function for the economy. Use the purple points (diamond symbol) to plot consumption plus investment. Use the tan points (rectangle symbol) to plot consumption plus investment plus governn spending. Finally, use the blue points (circle symbol) to plot consumption plus investment plus government spending plus net exports.
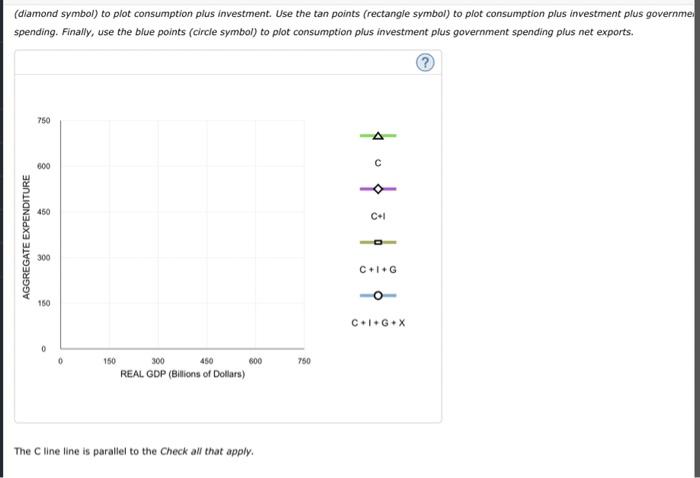
(diamond symbol) to plot consumption plus investment. Use the tan points (rectangle symbol) to plot consumption plus investment plus governme, spending. Finally, use the blue points (circle symbol) to plot consumption plus investment plus government spending plus net exports. The \( \mathrm{C} \) line line is parallel to the Check all that apply.
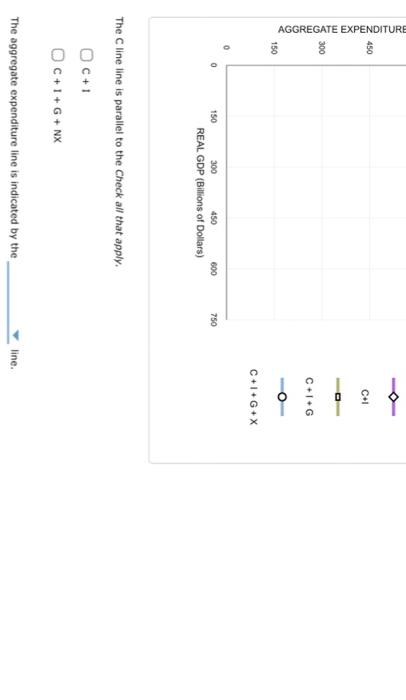
The \( \mathrm{C} \) line line is parallel to the Check all that apply. \[ \begin{array}{l} \mathrm{C}+1 \\ \mathrm{C}+1+\mathrm{G}+\mathrm{NX} \end{array} \] The aggregate expenditure line is indicated by the line.
Expert Answer
C+I+G line is parallel to C line. T