Home /
Expert Answers /
Statistics and Probability /
the-table-below-shows-a-stem-and-leaf-diagram-for-a-sample-of-test-scores-of-students-in-liberal-a-pa733
(Solved): The table below shows a stem-and-leaf diagram for a sample of test scores of students in Liberal A ...
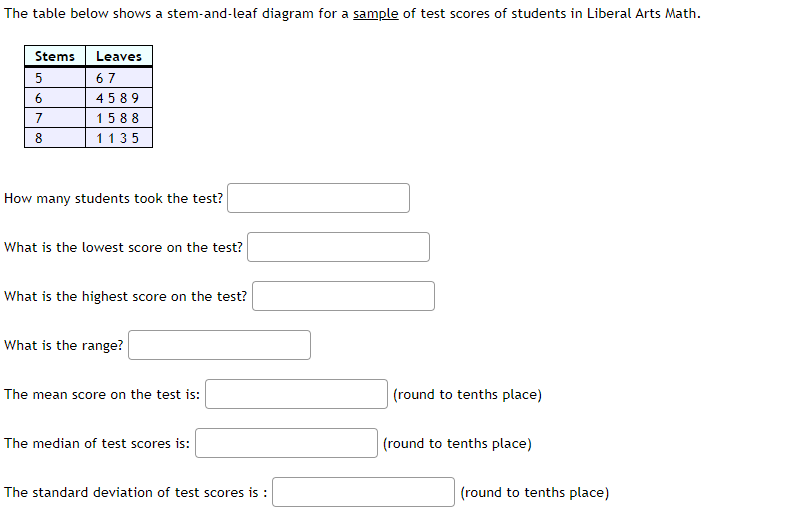
The table below shows a stem-and-leaf diagram for a sample of test scores of students in Liberal Arts Math. How many students took the test? What is the lowest score on the test? What is the highest score on the test? What is the range? The mean score on the test is: (round to tenths place) The median of test scores is: (round to tenths place) The standard deviation of test scores is : (round to tenths place)