(Solved): The Restaurant Tips data in StatKey produces the scatterplot and summary statistics below. SHOW WORK ...
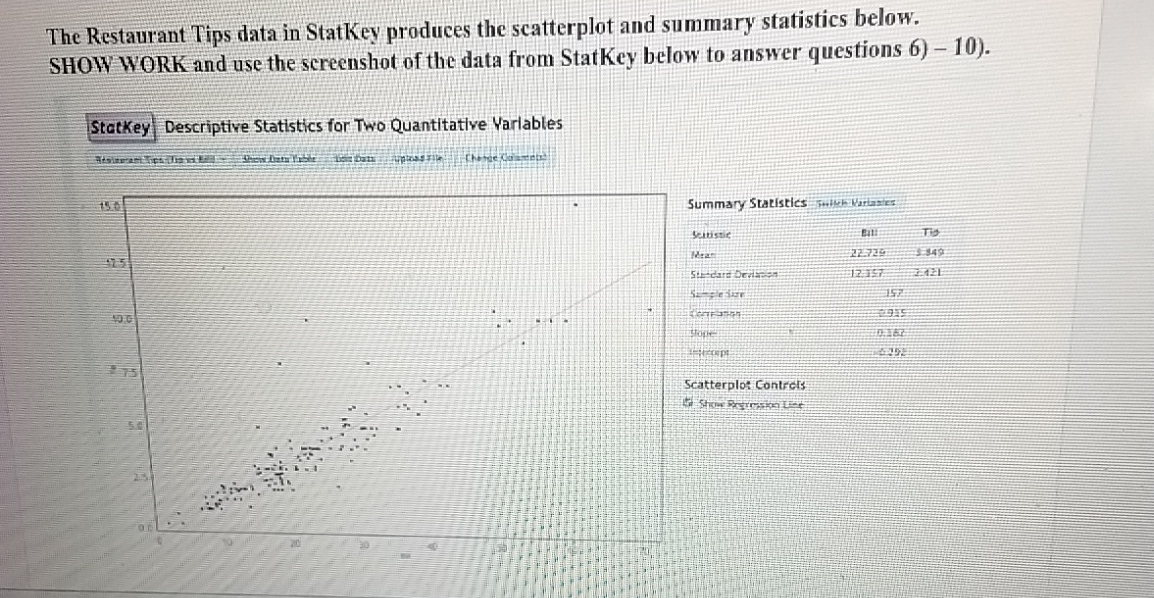
The Restaurant Tips data in StatKey produces the scatterplot and summary statistics below. SHOW WORK and use the screenshot of the data from StatKey below to answer questions 6) - 10). Statkey Descriptive Statistics for Two Quantitative Variables Summary Statistics imileh Narlazes \table[[conistic,Eit!,T3],[Hear,22.725,5. 349],[51-dara Derlan=?,12:15%,2.421],[52->cjaye,157,],[Feratarat,$975,],[प्रका,7.15%,],[-
(1)/(c)opp,大302:,]] Scatterplos Contras (2pts) Describe the strength and direction of the correlation. (4pts) Write a linear regression equation in the form
widehat(Tip)=a+b(Bill). ( 3 pts ) What would be the predicted tip for a restaurant bill of
$23.70? Show work. (4pts) A
$23.70Bill in the data set gave a
$10.00Tip. Calculate the residual for this bill. Did they tip higher or lower than what was expected? (2pts) Describe the meaning of the slope in the context of this problem: