Home /
Expert Answers /
Advanced Math /
the-rectangles-in-the-graph-below-illustrate-a-left-endpoint-riemann-sum-for-f-x-frac-x-2-pa543
(Solved): The rectangles in the graph below illustrate a left endpoint Riemann sum for \( f(x)-\frac{x^{2}}{ ...
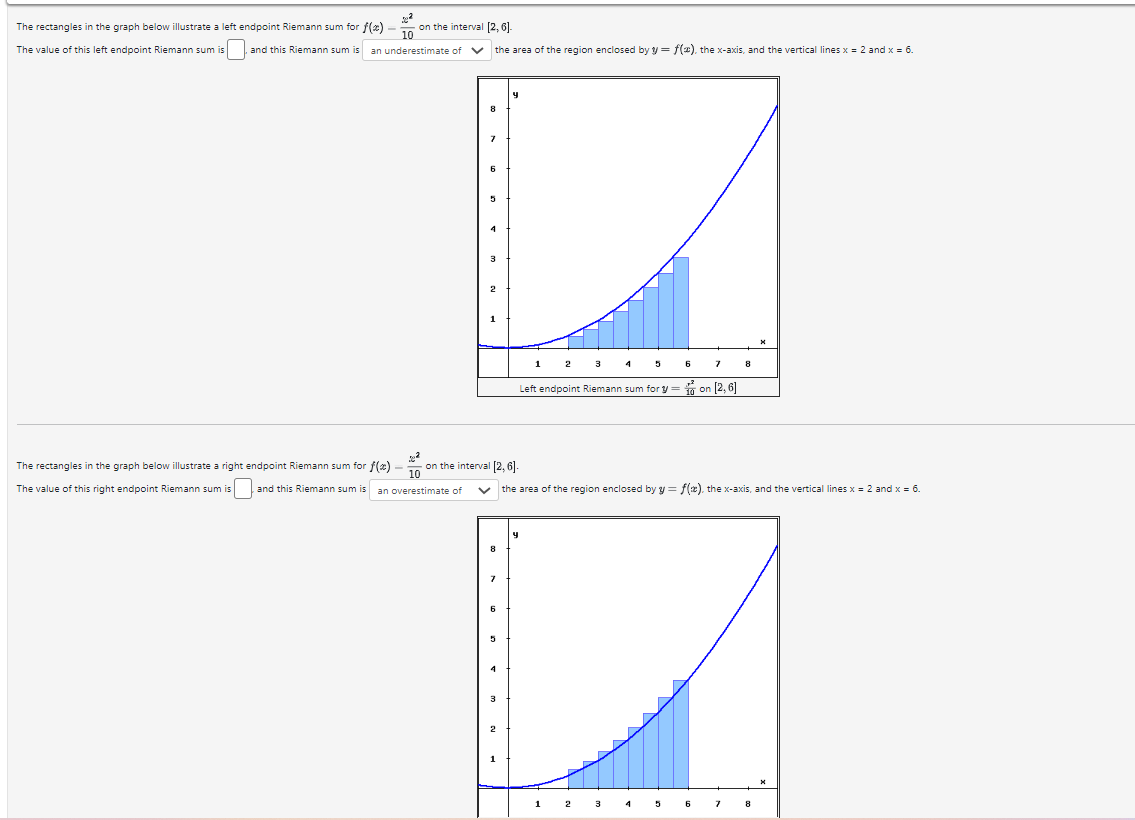
The rectangles in the graph below illustrate a left endpoint Riemann sum for \( f(x)-\frac{x^{2}}{10} \) on the interval \( [2,6] \). The value of this left endpoint Riemann sum is and this Riemann sum is the area of the region enclosed by \( y=f(x) \), the \( \mathrm{x} \)-axis, and the vertical lines \( \mathrm{x}=2 \) and \( \mathrm{x}=6 \). The rectangles in the graph below illustrate a right endpoint Riemann sum for \( f(x)-\frac{x^{2}}{10} \) on the interval \( [2,6] \). The value of this right endpoint Riemann sum is and this Riemann sum is the area of the region enclosed by \( y=f(x) \), the \( x \)-axis, and the vertical lines \( x=2 \) and \( x=6 \).
Expert Answer
Given f(x)=x210, on the interval [2,6] The left Riemann sum uses the left endpoint of a subinterval. ?abf(x)dx??x(