Home /
Expert Answers /
Statistics and Probability /
the-height-of-your-workstation-desk-is-one-of-the-essential-criteria-for-creating-the-perfect-ergo-pa906
(Solved): The height of your workstation desk is one of the essential criteria for creating the perfect ergo ...
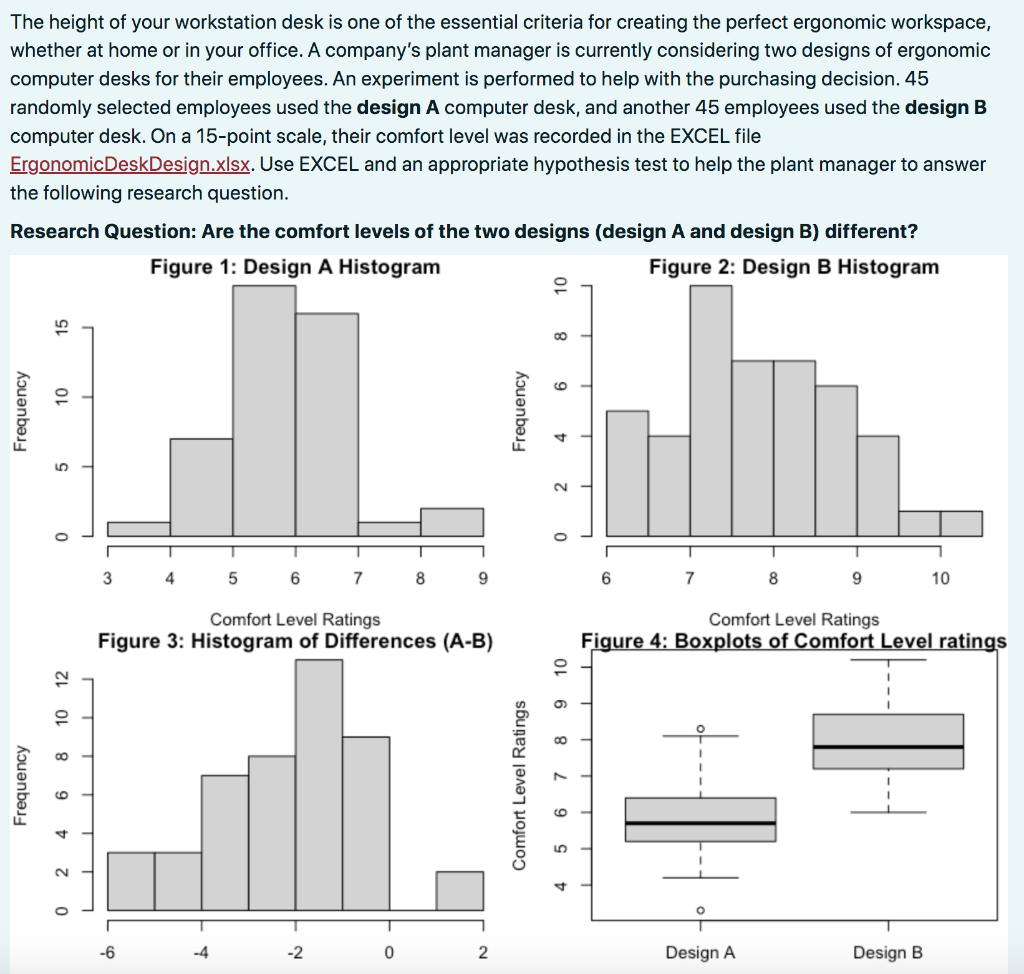
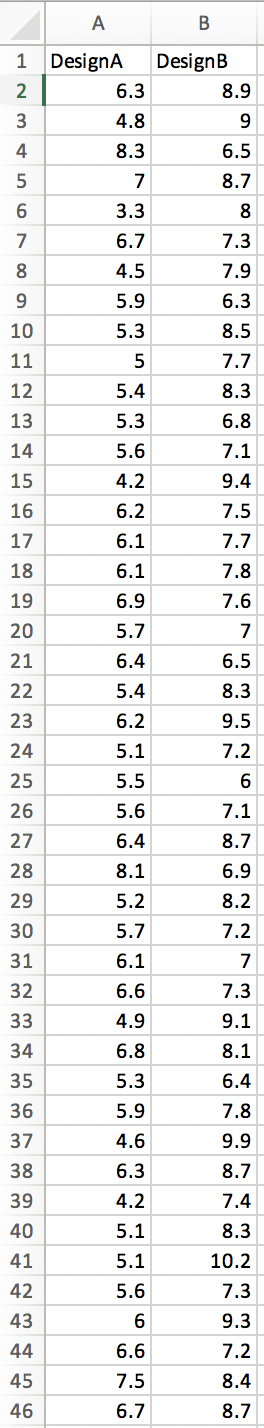
The height of your workstation desk is one of the essential criteria for creating the perfect ergonomic workspace, whether at home or in your office. A company's plant manager is currently considering two designs of ergonomic computer desks for their employees. An experiment is performed to help with the purchasing decision. 45 randomly selected employees used the design A computer desk, and another 45 employees used the design B computer desk. On a 15-point scale, their comfort level was recorded in the EXCEL file ErgonomicDeskDesign.xlsx. Use EXCEL and an appropriate hypothesis test to help the plant manager to answer the following research question. Research Question: Are the comfort levels of the two designs (design A and design B) different?
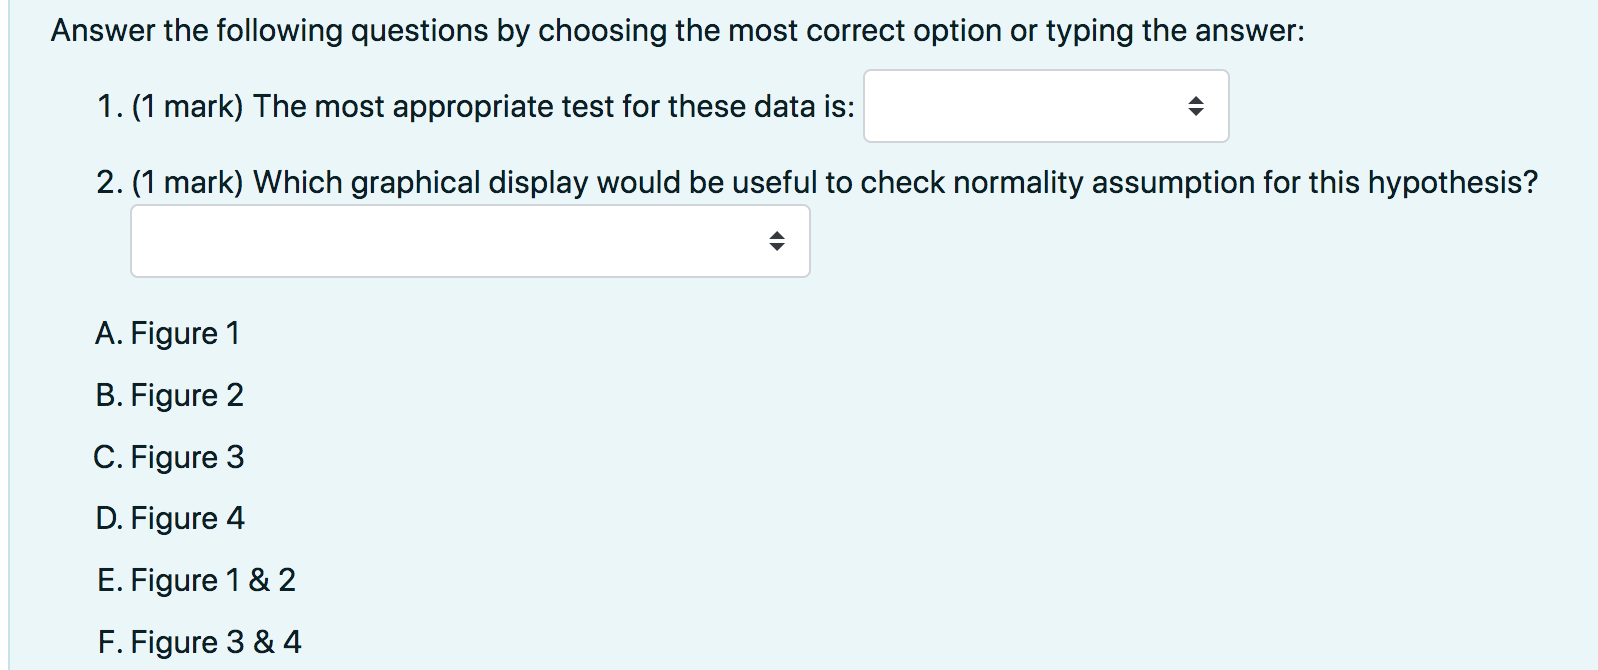
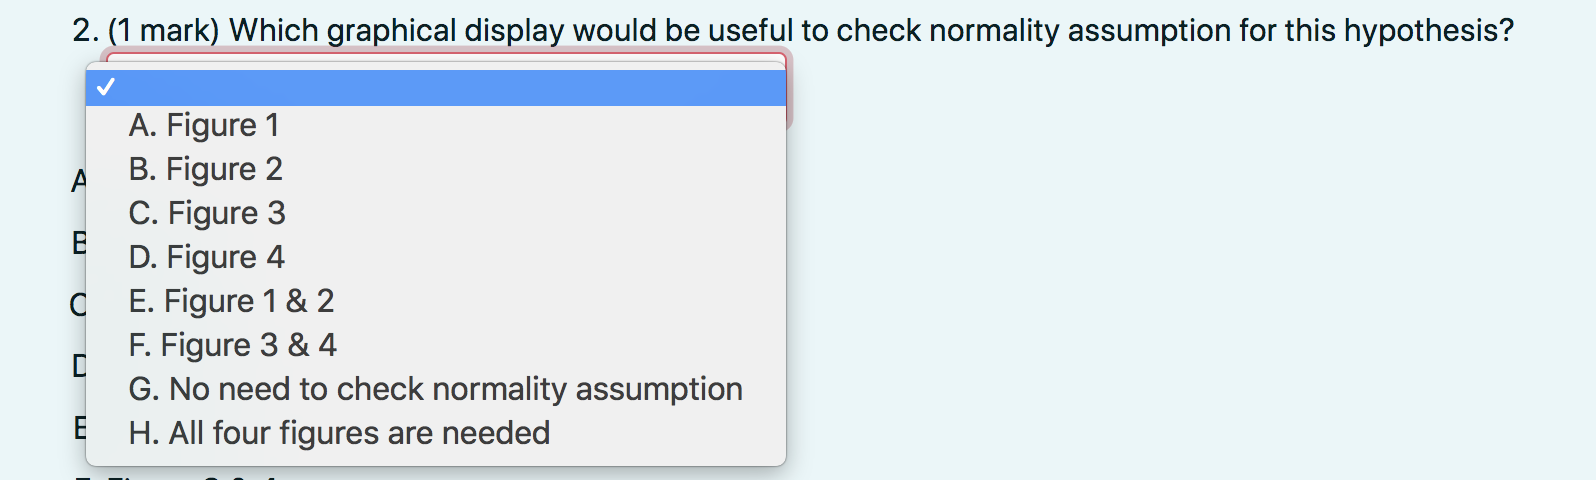
Answer the following questions by choosing the most correct option or typing the answer: 1. (1 mark) The most appropriate test for these data is: 2. (1 mark) Which graphical display would be useful to check normality assumption for this hypothesis? A. Figure 1 B. Figure 2 C. Figure 3 D. Figure 4 E. Figure \( 1 \& 2 \) F. Figure 3 \& 4
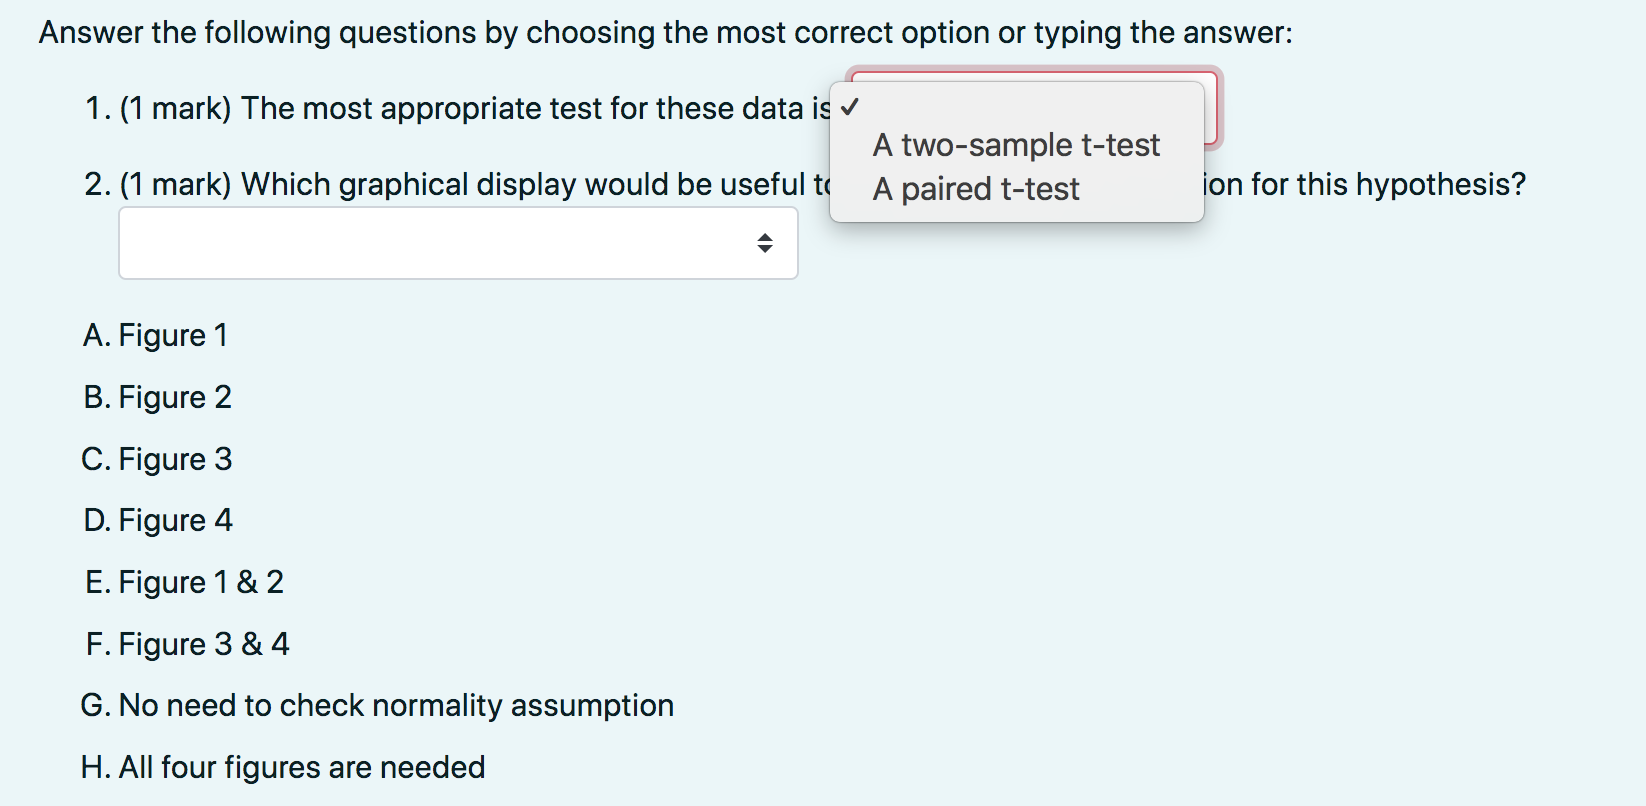
Answer the following questions by choosing the most correct option or typing the answer: 1. (1 mark) The most appropriate test for these data is 2. (1 mark) Which graphical display would be useful ts in for this hypothesis? A. Figure 1 B. Figure 2 C. Figure 3 D. Figure 4 E. Figure \( 1 \& 2 \) F. Figure 3 \& 4 G. No need to check normality assumption H. All four figures are needed
A. Figure 1 B. Figure 2 C. Figure 3 D. Figure 4 E. Figure \( 1 \& 2 \) F. Figure 3 \& 4 G. No need to check normality assumption H. All four figures are needed
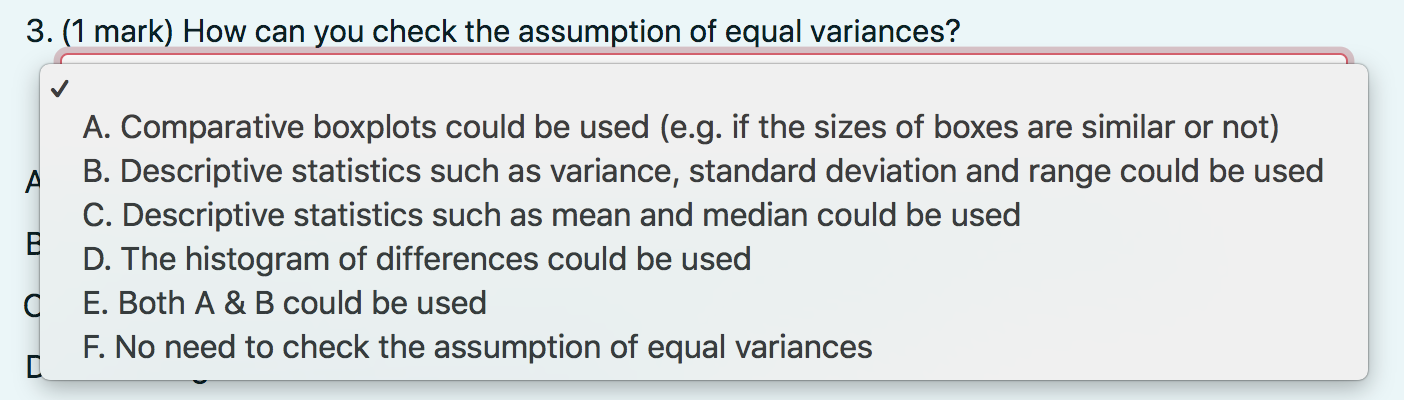
3. (1 mark) How can you check the assumption of equal variances? A. Comparative boxplots could be used (e.g. if the sizes of boxes are similar or not) B. Descriptive statistics such as variance, standard deviation and range could be used C. Descriptive statistics such as mean and median could be used D. The histogram of differences could be used E. Both \( A \) \& \( B \) could be used F. No need to check the assumption of equal variances
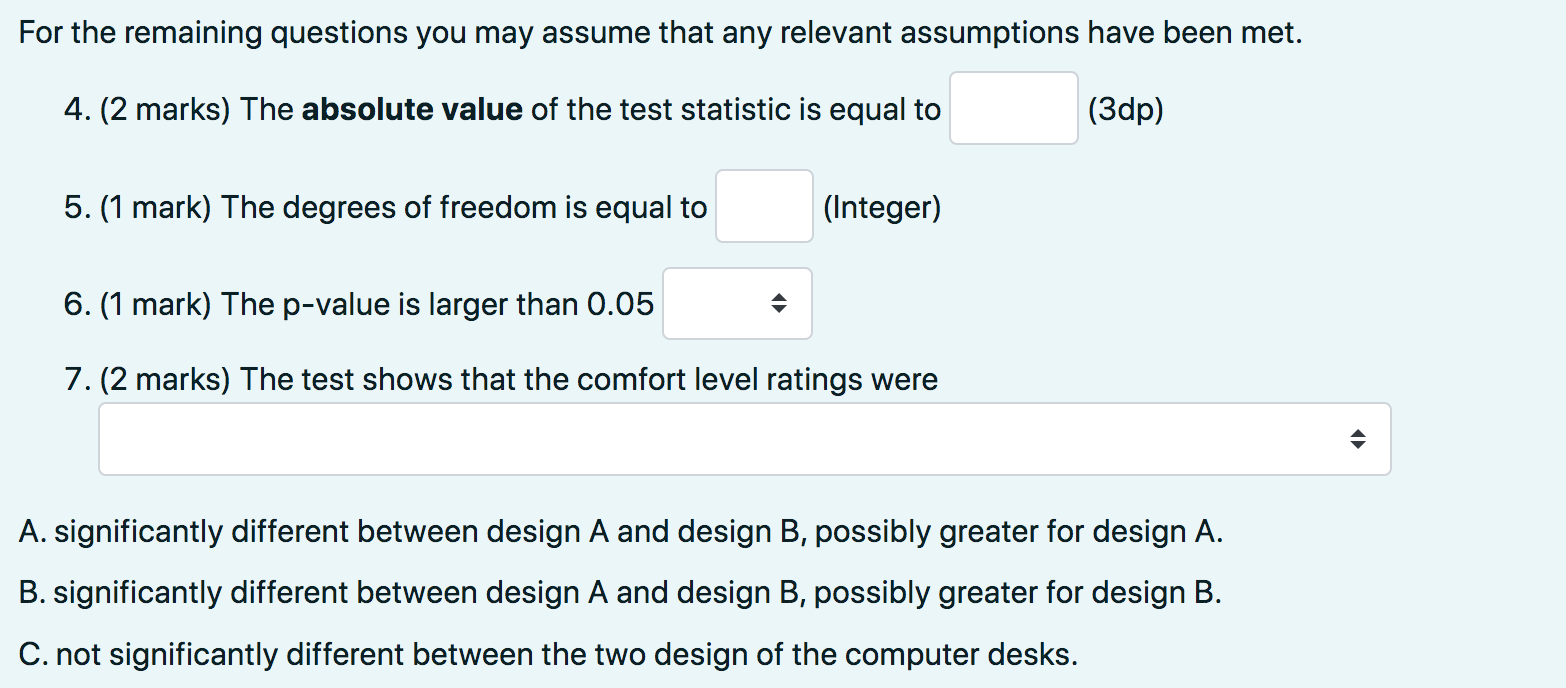
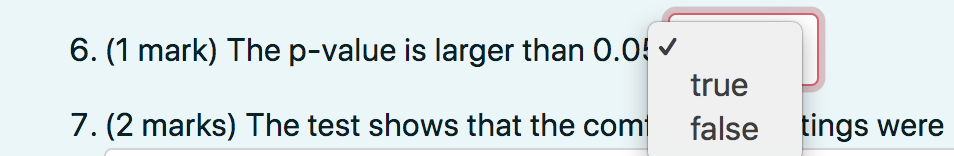
For the remaining questions you may assume that any relevant assumptions have been met. 4. (2 marks) The absolute value of the test statistic is equal to (3dp) 5. (1 mark) The degrees of freedom is equal to (Integer) 6. (1 mark) The \( p \)-value is larger than \( 0.05 \) 7. (2 marks) The test shows that the comfort level ratings were A. significantly different between design \( A \) and design \( B \), possibly greater for design \( A \). B. significantly different between design \( A \) and design \( B \), possibly greater for design \( B \). C. not significantly different between the two design of the computer desks.
6. ( 1 mark) The \( \mathrm{p} \)-value is larger than \( 0.0 \) ! 7. (2 marks) The test shows that the com ngs were
7. (2 marks) The test shows that the comfort level ratings were A. significantly different between design \( A \) and design \( B \), possibly greater for design \( A \). B. significantly different between design \( A \) and design \( B \), possibly greater for design \( B \). C. not significantly different between the two design of the computer desks.
Expert Answer
1. As there are two independent samples and we want to compare their means, we should u