Home /
Expert Answers /
Statistics and Probability /
the-graph-below-shows-the-relationship-between-the-number-of-years-of-smoking-and-inhaling-and-th-pa196
(Solved): The graph below shows the relationship between the number of years of smoking and inhaling and th ...
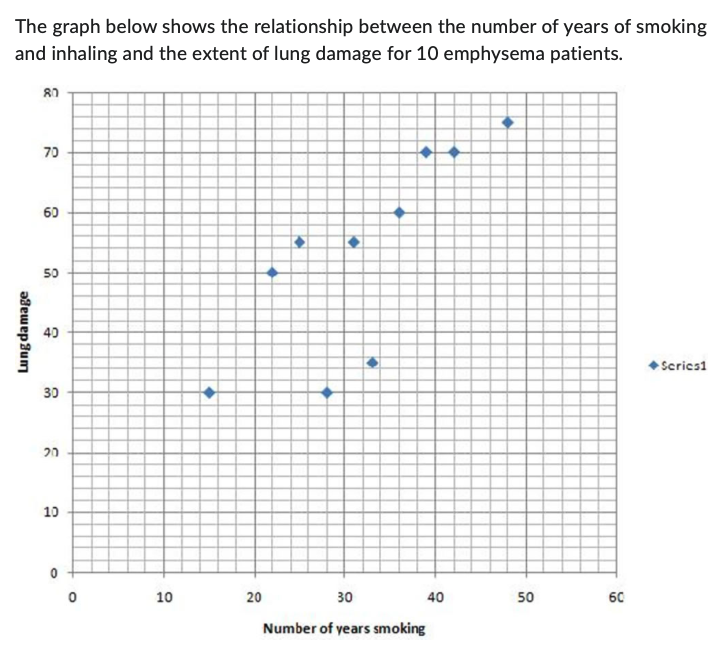

The graph below shows the relationship between the number of years of smoking and inhaling and the extent of lung damage for 10 emphysema patients.
Does the graph suggest that there is a linear relationship between smoking and lung damage? Explain your reasoning.