Home /
Expert Answers /
Economics /
the-graph-below-shows-a-decrease-in-the-demand-for-a-specific-product-from-do-to-d-as-a-result-pa260
(Solved): The graph below shows a decrease in the demand for a specific product, from Do to D, as a result ...
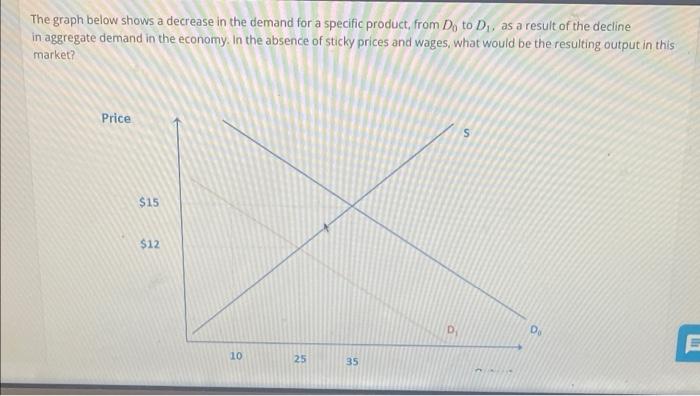

The graph below shows a decrease in the demand for a specific product, from Do to D?, as a result of the decline in aggregate demand in the economy. In the absence of sticky prices and wages, what would be the resulting output in this market? Price $15 $12 10 25 35 D Do E
Provide your answer below: units
Expert Answer
Suppose if the demand decline in the economy the resultin