Home /
Expert Answers /
Chemistry /
the-graph-below-represents-the-t-phase-diagram-for-a-substance-at-p1-nbsp-at-1-atm-i-would-appre-pa822
(Solved): The graph below represents the -T phase diagram for a substance at P1 at 1 atm. I would appre ...
The graph below represents the ?-T phase diagram for a substance at P1 at 1 atm. I would appreciate help answering the following questions.
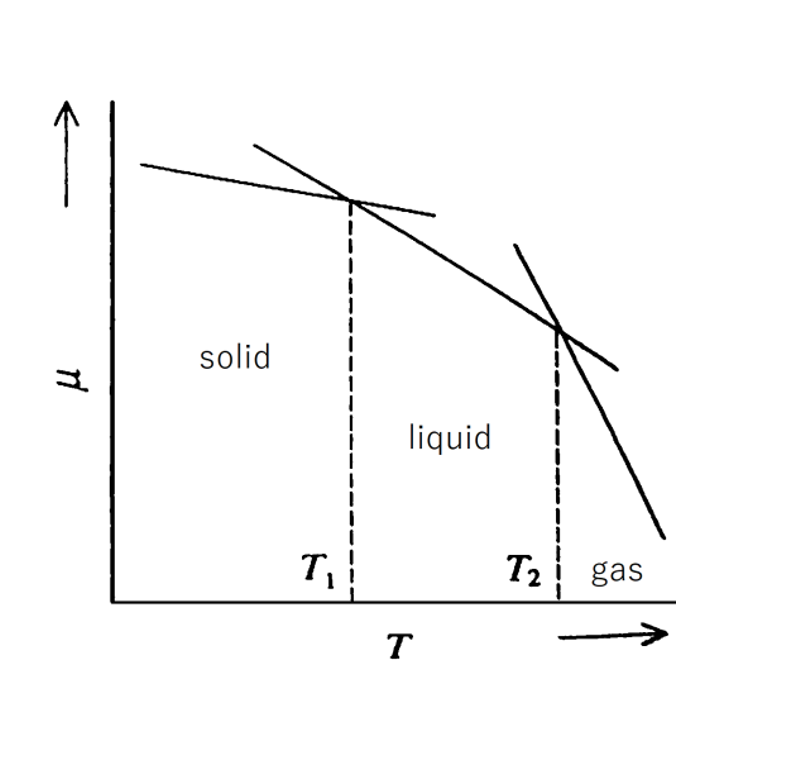
1) What does the ?-T line mean, and what do T1 and T2 mean? Also, briefly explain why a phase change occurs using equation.
2) Draw a diagram in the graph to show what may happen to the straight ?-T line when pressure increases to P2 and briefly explain the reasoning behind it using equation. Note that P2>P1.
Thank You :)
ri solid T? 1 liquid T T? gas
Expert Answer
1 , T1&t2 are temprature at