Home /
Expert Answers /
Biology /
the-graph-below-represents-the-adult-hemoglobin-binding-curve-at-mathrm-ph-7-4-in-the-prese-pa213
(Solved): The graph below represents the adult hemoglobin binding curve at \( \mathrm{pH} 7.4 \) in the prese ...
![A) The \( \mathrm{CO}_{2} \) concentration in blood increases [2 marks]
B) Tetrameric hemoglobin is dissociated into its subu](https://media.cheggcdn.com/study/059/05978634-d3fe-4e0c-bc40-c51810ea6582/image)
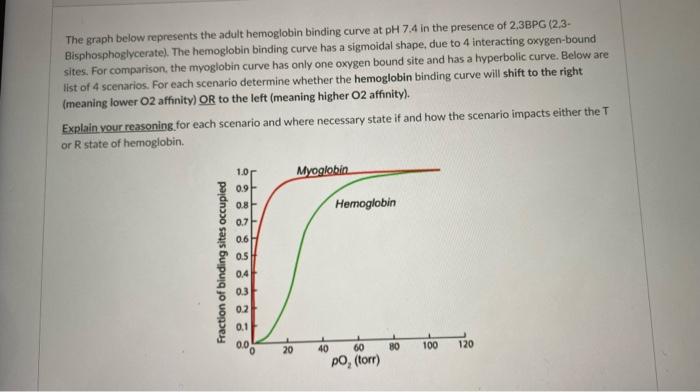
The graph below represents the adult hemoglobin binding curve at \( \mathrm{pH} 7.4 \) in the presence of \( 2,3 \mathrm{BPG}(2,3 \) Bisphosphoglycerate). The hemoglobin binding curve has a sigmoidal shape, due to 4 interacting oxygen-bound sites. For comparison, the myoglobin curve has only one oxygen bound site and has a hyperbolic curve. Below are list of 4 scenarios. For each scenario determine whether the hemoglobin binding curve will shift to the right (meaning lower O2 affinity) OR to the left (meaning higher \( \mathrm{O} 2 \) affinity). Explain your reasoning for each scenario and where necessary state if and how the scenario impacts either the \( T \) or \( R \) state of hemogiobin.
A) The \( \mathrm{CO}_{2} \) concentration in blood increases [2 marks] B) Tetrameric hemoglobin is dissociated into its subunits [2 marks] C) Hemoglobin is isolated from red blood cells and stripped of 2,3BPG [ 2 marks] D) The blood \( \mathrm{pH} \) drops from \( 7.4 \) to \( 7.2 \) [2 marks]
Expert Answer
1. When CO2 concentration in blood increases, breathing becomes faster and deeper. The effect of rising CO2 concentration is due to decrease in affinity of Hb for O2. Thus, the CO2 released in the tissues accelerates the delivery of O2 (called Bohr e