Home /
Expert Answers /
Statistics and Probability /
the-following-table-shows-the-world-record-times-for-the-200-mathrm-m-race-for-flying-sta-pa276
(Solved): The following table shows the world record times for the \( 200 \mathrm{~m} \) race for flying sta ...
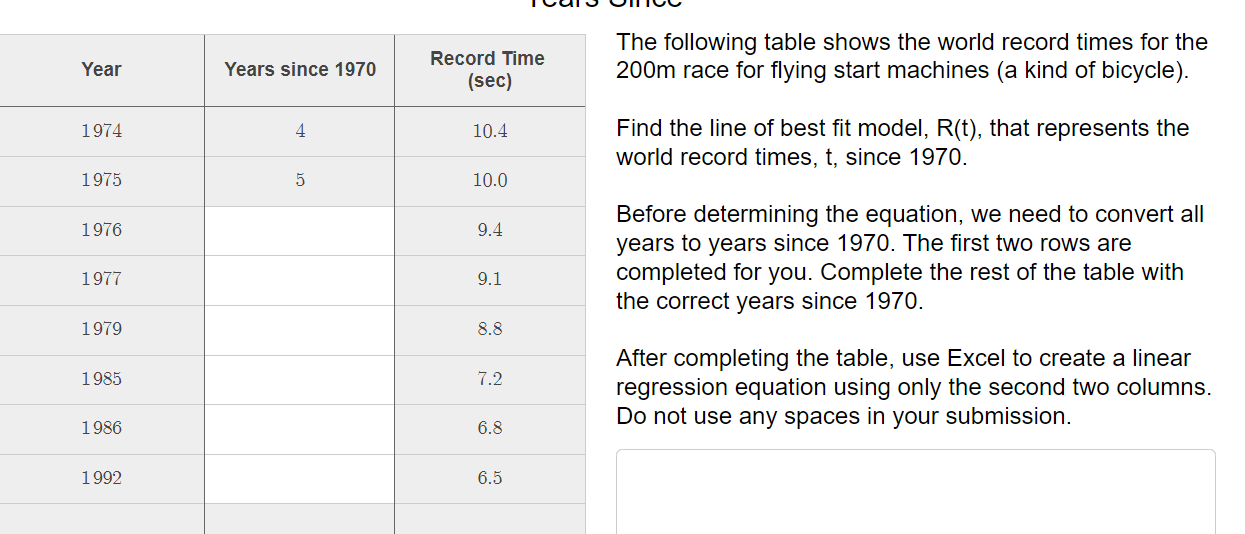
The following table shows the world record times for the \( 200 \mathrm{~m} \) race for flying start machines (a kind of bicycle). Find the line of best fit model, \( \mathrm{R}(\mathrm{t}) \), that represents the world record times, t, since \( 1970 . \) Before determining the equation, we need to convert all years to years since 1970 . The first two rows are completed for you. Complete the rest of the table with the correct years since \( 1970 . \) After completing the table, use Excel to create a linear regression equation using only the second two columns. Do not use any spaces in your submission.
Expert Answer
Here is your answer- As R(t) denotes the world record time since 1970 So reg