Home /
Expert Answers /
Operations Management /
the-following-table-shows-the-actual-demand-observed-over-the-last-11-years-using-exponential-smo-pa715
(Solved): The following table shows the actual demand observed over the last 11 years: Using exponential smo ...
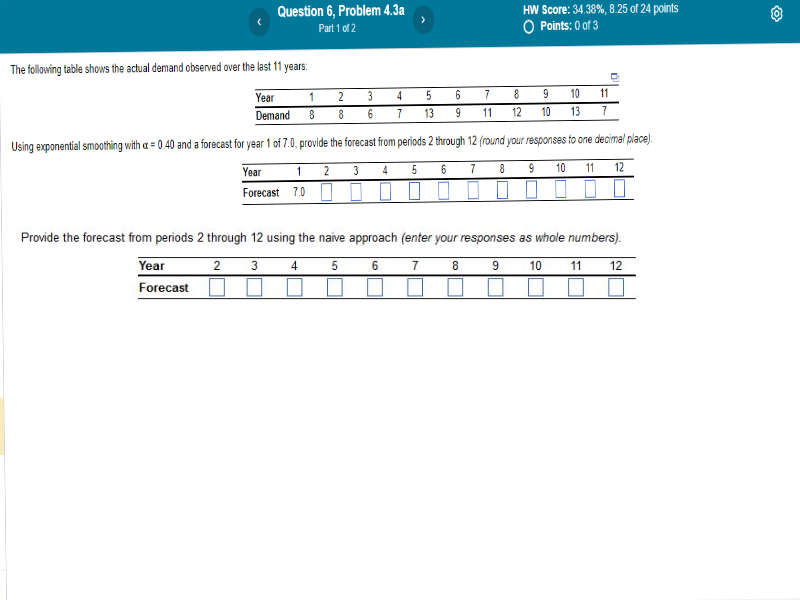
The following table shows the actual demand observed over the last 11 years: Using exponential smoothing with \( \alpha=0.40 \) and a forecast for year 1 of \( 7.0 \), provide the forecast from periods 2 through 12 (round your responses to one decimal plac Provide the forecast from periods 2 through 12 using the naive approach (enter your responses as whole numbers).
Expert Answer
1. Exponential smoothing Alpha = 0.4 Forecast = (Yt * 0.4 ) + (St * (1 - 0.4)) Where yt = previous actual demand St = previous forecast Forecast for Year 2 = (8 * 0.4 ) + (7 * (1 - 0.4))