Home /
Expert Answers /
Statistics and Probability /
the-following-table-lists-a-portion-of-the-average-writing-and-math-sat-scores-for-the-50-states-a-pa638
(Solved): The following table lists a portion of the average writing and math SAT scores for the 50 states a ...
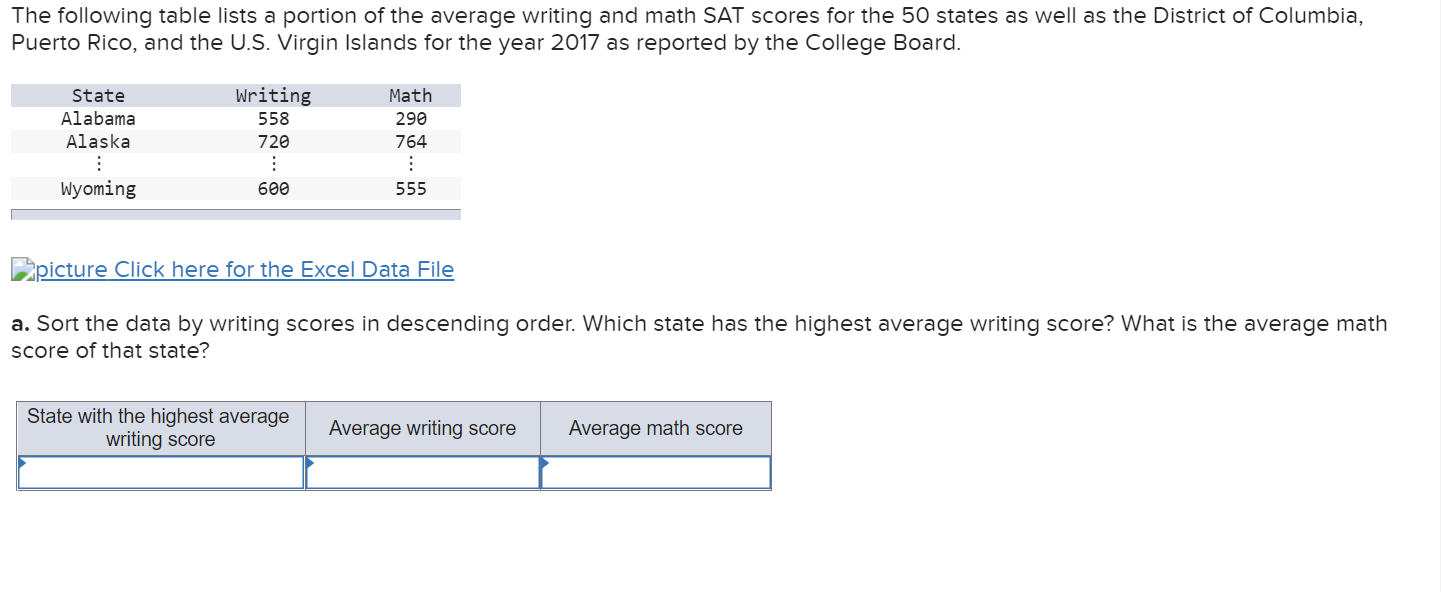
The following table lists a portion of the average writing and math SAT scores for the 50 states as well as the District of Columbia, Puerto Rico, and the U.S. Virgin Islands for the year 2017 as reported by the College Board. State Alabama Alaska ? Wyoming Writing 558 720 600 Math 290 764 ? 555 picture Click here for the Excel Data File a. Sort the data by writing scores in descending order. Which state has the highest average writing score? What is the average math score of that state? State with the highest average writing score Average writing score Average math score
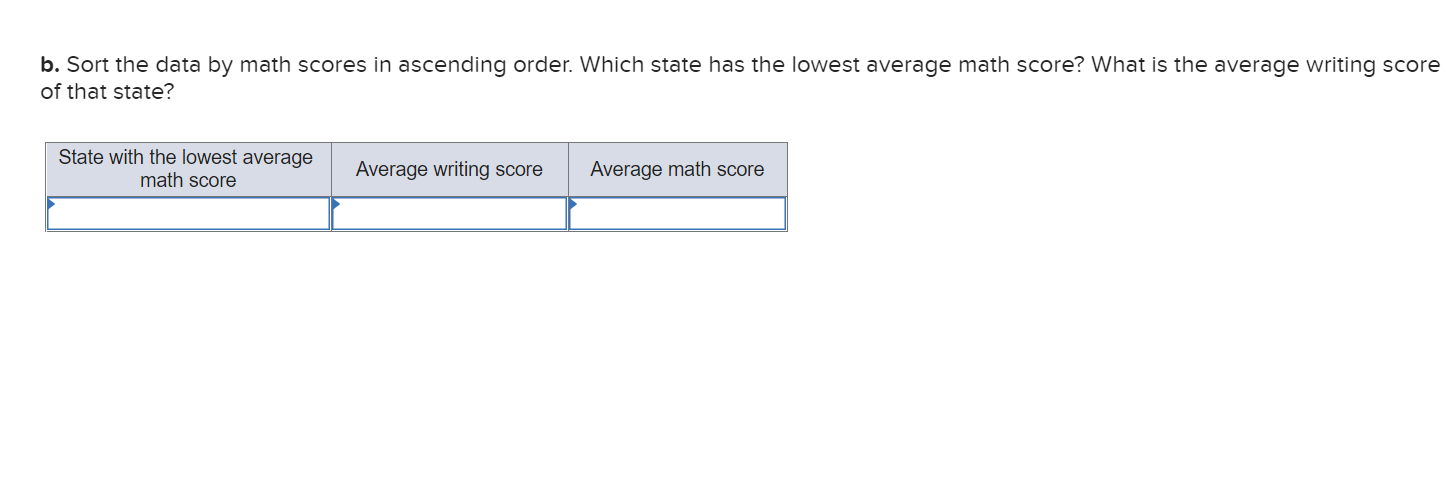
b. Sort the data by math scores in ascending order. Which state has the lowest average math score? What is the average writing score of that state? State with the lowest average math score Average writing score Average math score
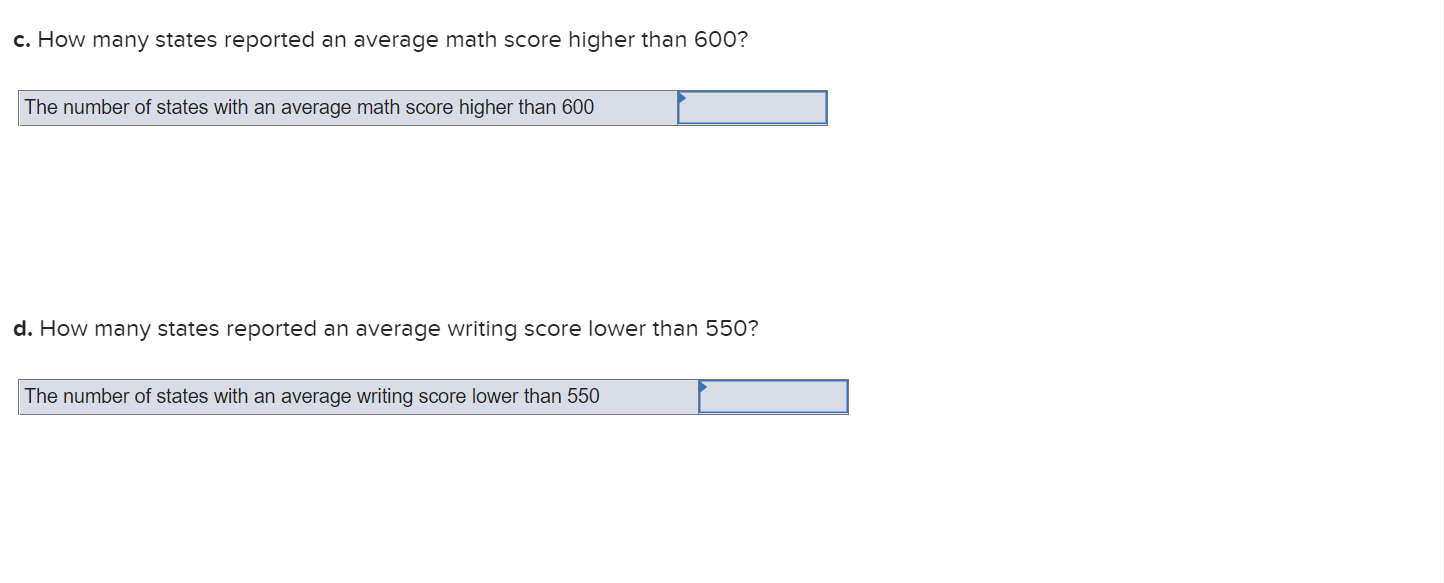
c. How many states reported an average math score higher than 600? The number of states with an average math score higher than 600 d. How many states reported an average writing score lower than 550? The number of states with an average writing score lower than 550
Expert Answer
a.Sorting the data by writing scores in descending order: Alabama has the highest average writi


