Home /
Expert Answers /
Chemistry /
the-following-plot-was-acquired-for-data-from-a-hydrogen-lamp-spectrum-and-plotted-according-to-pa686
(Solved): The following plot was acquired for data from a hydrogen lamp spectrum, and plotted according to ...
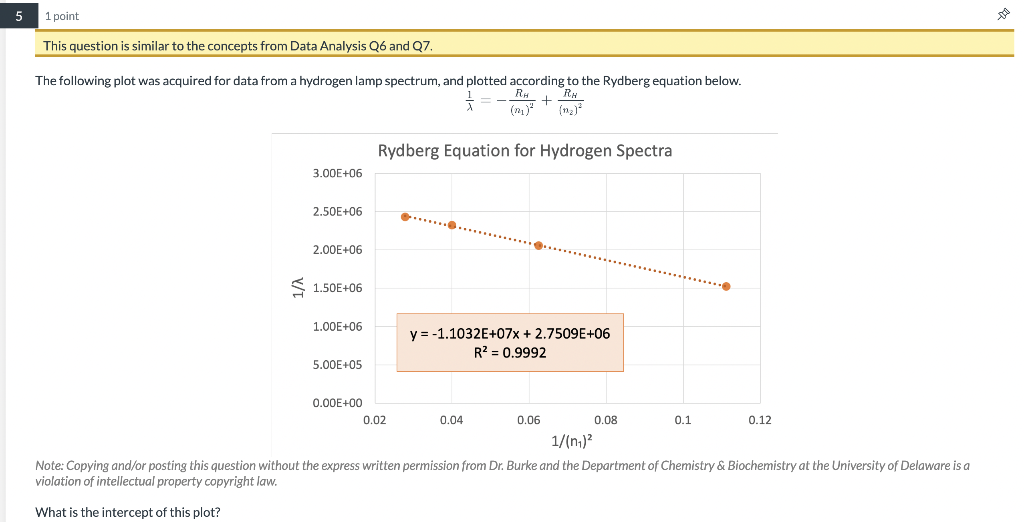
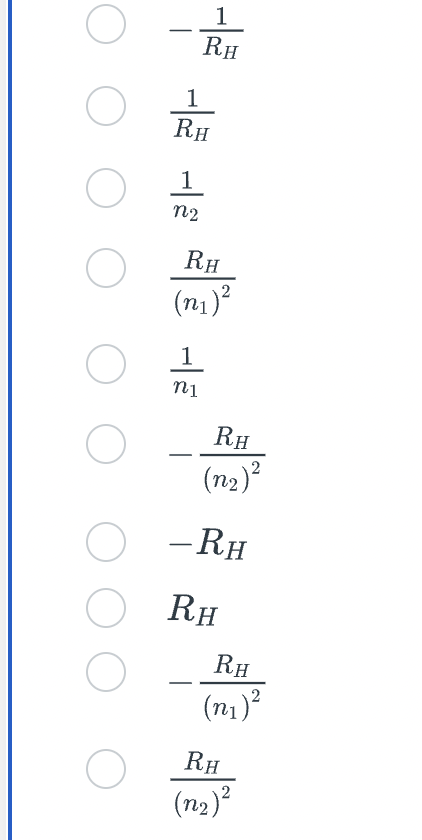
The following plot was acquired for data from a hydrogen lamp spectrum, and plotted according to the Rydberg equation below. Note: Copying and/or posting this question without the express written permission from Dr. Burke and the Department of Chemistry \& Biochemistry at the University of Delaware is a violation of intellectual property copyright law. What is the intercept of this plot?
Expert Answer
Given :-The equation is written as 1?=?RH(n1)2+RH(n2)2 ........(1)and y=?1.1032E+07x

