Home /
Expert Answers /
Finance /
the-following-graph-shows-the-short-run-average-total-cost-curves-and-the-long-run-average-cost-cur-pa944
(Solved): The following graph shows the short-run average total cost curves and the long-run average cost cur ...
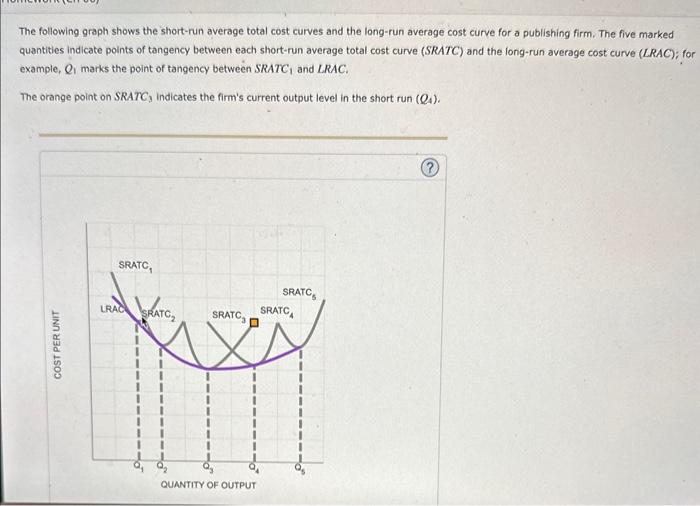
The following graph shows the short-run average total cost curves and the long-run average cost curve for a publishing firm. The five marked quantities indicate points of tangency between each short-run average total cost curve (SRATC) and the long-run average cost curve (LRAC); for example, marks the point of tangency between SRATC and LRAC. The orange point on SRATC, indicates the firm's current output level in the short run .
In the long run, if the firm decides to keep output at its initial level, what will it likely do? Shift to operate on SRATC SR . Shift to operate on Stay on but decrease to the point touching Shut down Over which range of output levels do you find diseconomies of scale? 0 to to Greater than 0 to 0 to