Home /
Expert Answers /
Economics /
the-following-graph-shows-the-market-for-wheat-in-canada-where-d-c-is-the-demand-curve-pa310
(Solved): The following graph shows the market for wheat in Canada, where \( D_{C} \) is the demand curve, \( ...
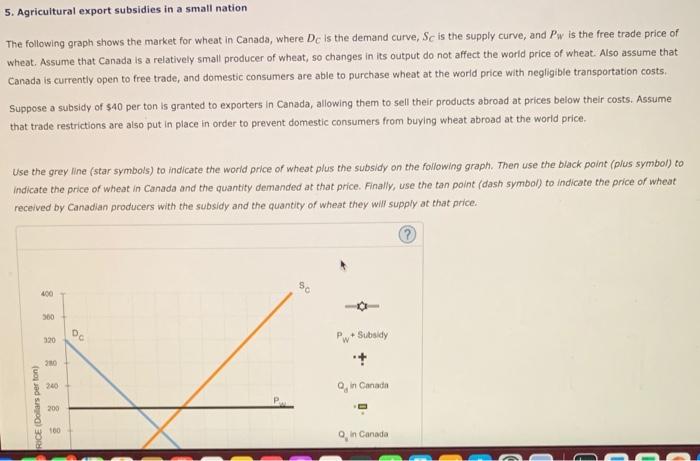
The following graph shows the market for wheat in Canada, where \( D_{C} \) is the demand curve, \( S_{C} \) is the supply curve, and \( P_{W} \) is the free trade price of wheat. Assume that Canada is a relatively small producer of wheat, so changes in its output do not affect the world price of wheat. Also assume that Canada is currently open to free trade, and domestic consumers are able to purchase wheat at the world price with negligible transportation costs. Suppose a subsidy of \( \$ 40 \) per ton is granted to exporters in Canada, allowing them to sell their products abroad at prices below their costs. Assume that trade restrictions are also put in place in order to prevent domestic consumers from buying wheat abroad at the world price. Use the grey line (star symbols) to indicate the world price of wheat plus the subsidy on the following graph. Then use the black point (plus symbol) to indicate the price of wheat in Canada and the quantity demanded at that price. Finaliy, use the tan point (dash symbol) to indicate the price of wheat received by Canadian producers with the subsidy and the quantity of wheat they will supply at that price.
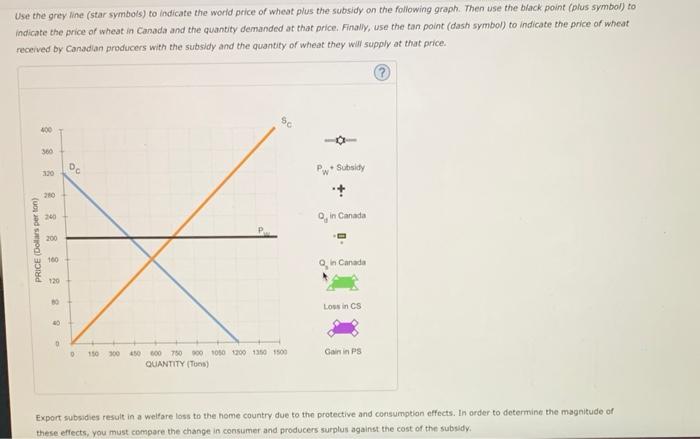
Use the grey line (star symbols) to indicate the world price of wheat plus the subsidy on the following graph. Then use the biack point (plus symbol) to indicate the price of wheat in Canada and the quantity demanded at that price. Finally, use the tan point (dash symbol) to indicate the price of wheat feceived by Canadian producers with the subsidy and the quantity of wheat they wim supply at that price. Export subsidies result in a welfare loss to the home country due to the protective and consumptian effects. In order to determine the magnitude of these effects, you must compare the change in consumer and producers surplus against the cost of the subsidy.
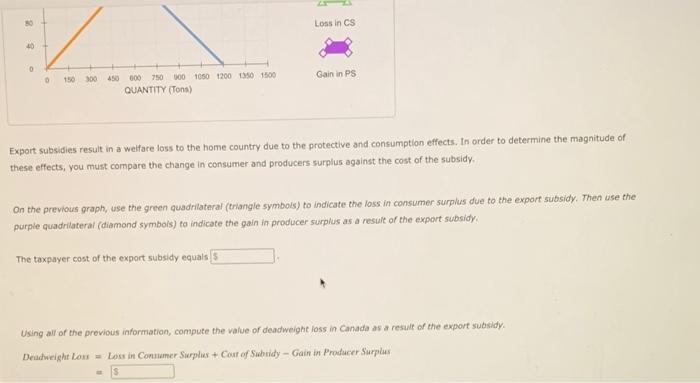
Export subsidies result in a welfare loss to the home country due to the protective and consumption effects. In order to determine the magnitude of these effects, you must compare the change in consumer and producers surplus against the cost of the subsidy. On the previous graph, use the green quadriateral (triangle symbols) to indicate the loss in consumer surphus due to the export subsidy. Then use the purpie quadrilateral (diamond symbois) to indicate the gain in producer surplus as a resuit of the export subsidy. The taxpayer cost of the export subsidy equals
Expert Answer
Ans:- "plz hit the like button it helps me a lot....thanks for visiting....plz don't dislike it leads to revocation of my account sir" In a small nation, when an export subsidy of $40 per ton