Home /
Expert Answers /
Economics /
the-following-graph-shows-the-isoquant-representing-the-combinatiens-of-capital-and-labar-needed-t-pa131
(Solved): The following graph shows the isoquant representing the combinatiens of capital and labar needed t ...
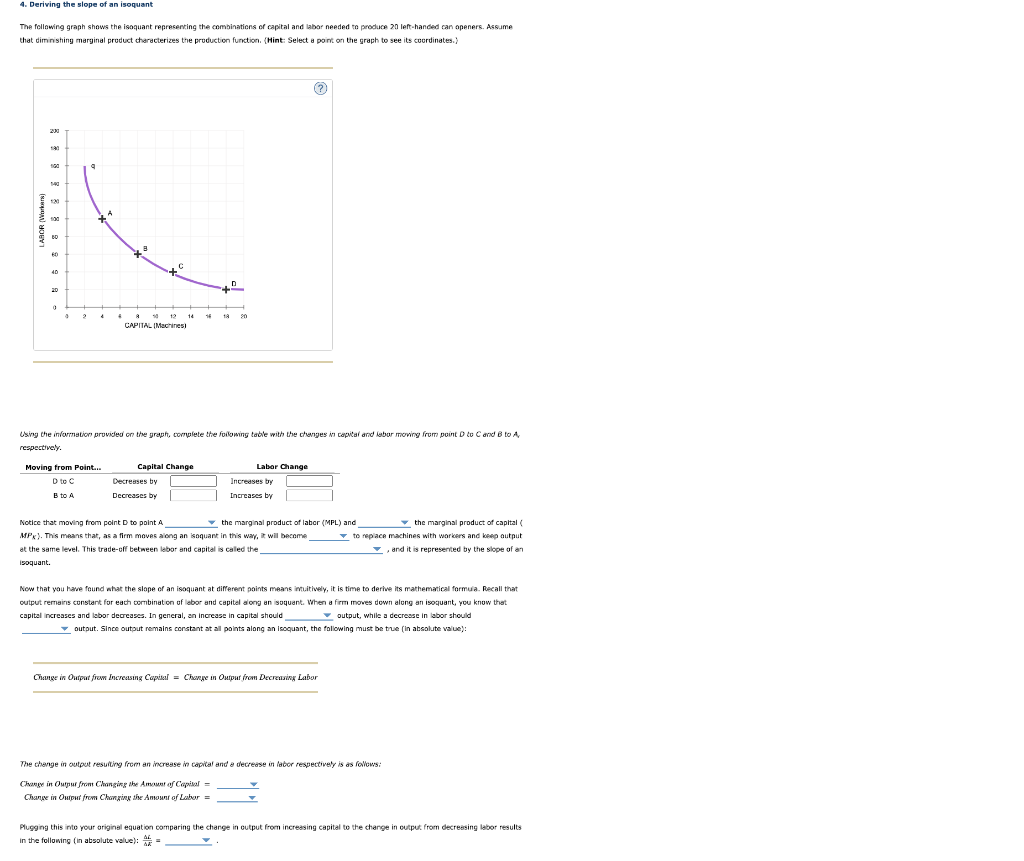
The following graph shows the isoquant representing the combinatiens of capital and labar needed to produce 70 left-handed can openers. Acs.ume that dimnishing marginal product chardcterizes the production furction. \{Hint: Select a port on the graph to see its coerdinates. \} Using the informstion provided on the graph, complete the foibuing table with the changes in capital and labar mowing frum point D to \( C \) and \( B \) to A. respettively. (?) Now that you have found what the slape of an isoquant at different points meanc im.itively, it is time to derive its mathematical formuia. Recall that cutput remains constant for each combinat on of abor and capitel siong an isoquant. When a firm moves down along an isoguant, you know that capital ncreases and lebor decreases. In general, an increase in capital should output, while a decresse in labor should output. Since outout remains conatant at all points alang an isoquant, the faliowing must be the (In absolute value): Change in Ourput from Encressing Capitsul = Change in Outpur from Decreusing Labor The change in output resuting focm an increase in capital and a decrease in fabor respectively is ds follews: Change in Ouiput from Chanzing the Amount of Labor = Pluggng this nte your ariginsl equation comparing the charge in eutput from increasing capital to the change in euput. from decressing labor results in the following (in absolute value): \( \frac{\Delta L}{\Delta \dot{E}}= \)
Expert Answer
SOLUTION:- Movement Capital increase Labor decrease M to N 4 40 O to P 6 20 From M to P, incre