Home /
Expert Answers /
Physics /
the-following-graph-shows-period-vs-mass-of-an-oscillating-spring-given-the-best-fit-line-on-t-pa977
(Solved): The following graph shows Period vs. Mass of an oscillating spring. Given the best fit line on t ...
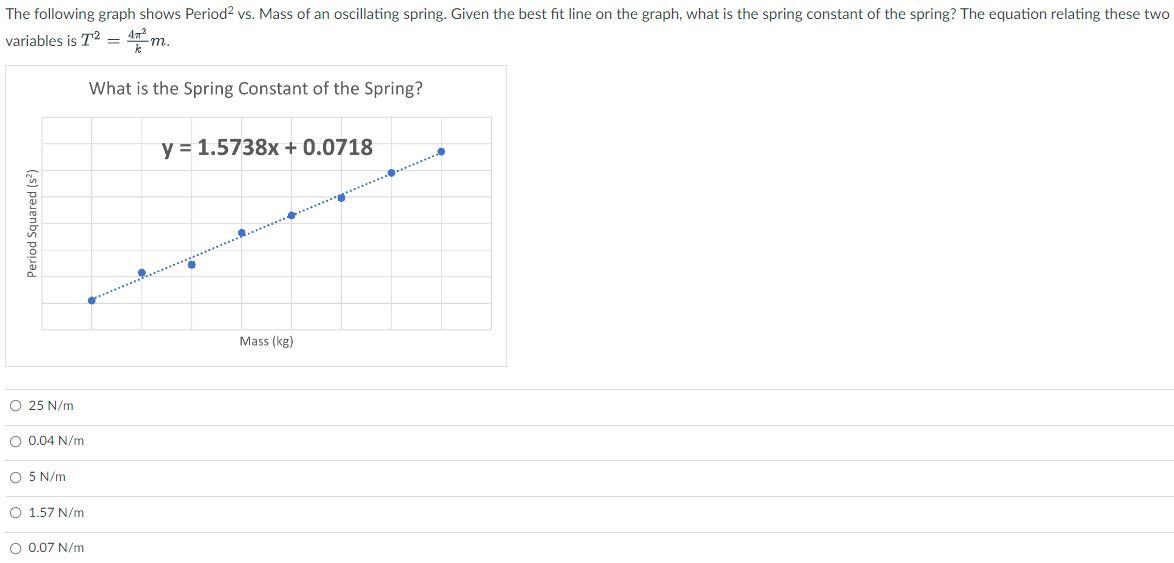
The following graph shows Period² vs. Mass of an oscillating spring. Given the best fit line on the graph, what is the spring constant of the spring? The equation relating these two variables is T2 = -m. Period Squared (s²) O 25 N/m O 0.04 N/m O 5 N/m O 1.57 N/m O 0.07 N/m What is the Spring Constant of the Spring? *********** y = 1.5738x + 0.0718 ........ Mass (kg)
Expert Answer
We know that the equation of straight line is given by, y = mx + c Wher