Home /
Expert Answers /
Economics /
the-following-graph-shows-a-hypothetical-economy-in-long-run-equilibrium-at-an-expected-price-leve-pa662
(Solved): The following graph shows a hypothetical economy in long-run equilibrium at an expected price leve ...
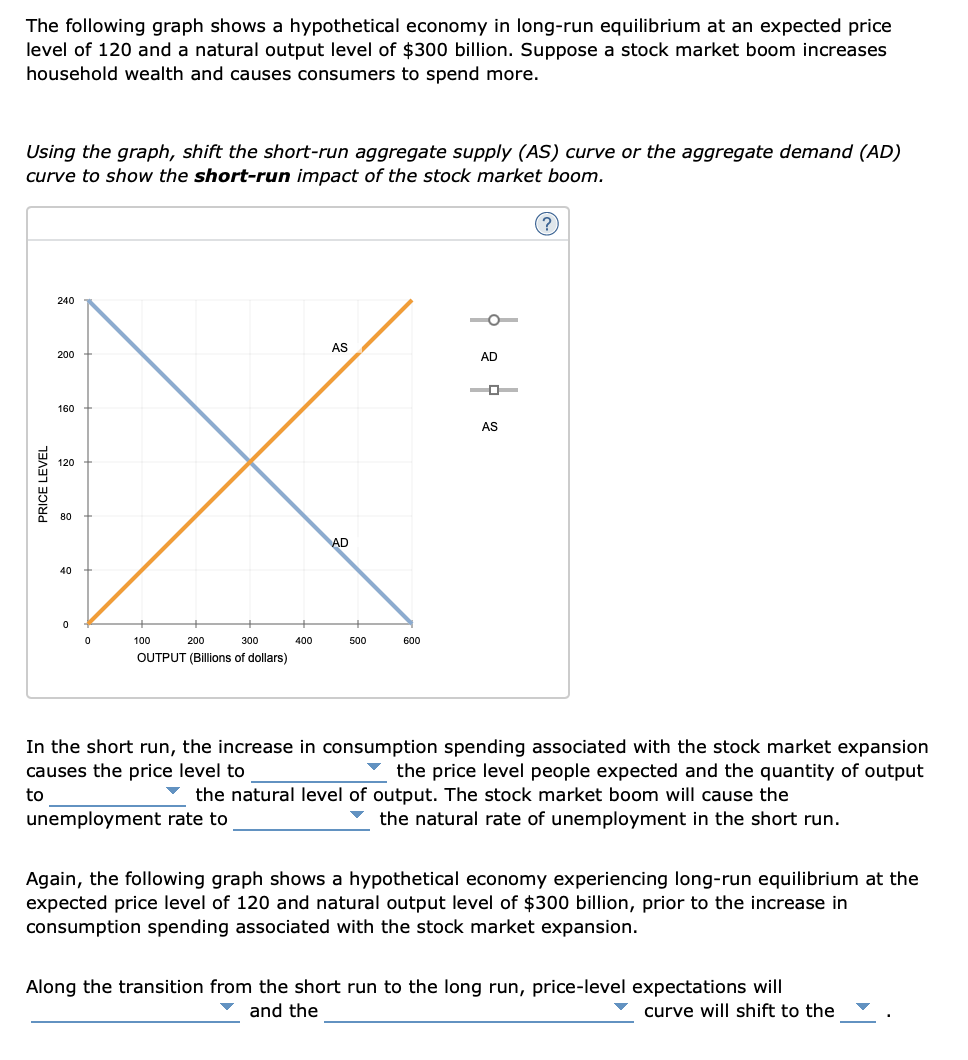
The following graph shows a hypothetical economy in long-run equilibrium at an expected price level of 120 and a natural output level of \( \$ 300 \) billion. Suppose a stock market boom increases household wealth and causes consumers to spend more. Using the graph, shift the short-run aggregate supply (AS) curve or the aggregate demand (AD) curve to show the short-run impact of the stock market boom. In the short run, the increase in consumption spending associated with the stock market expansion causes the price level to the price level people expected and the quantity of output to the natural level of output. The stock market boom will cause the unemployment rate to the natural rate of unemployment in the short run. Again, the following graph shows a hypothetical economy experiencing long-run equilibrium at the expected price level of 120 and natural output level of \( \$ 300 \) billion, prior to the increase in consumption spending associated with the stock market expansion. Along the transition from the short run to the long run, price-level expectations will and the curve will shift to the
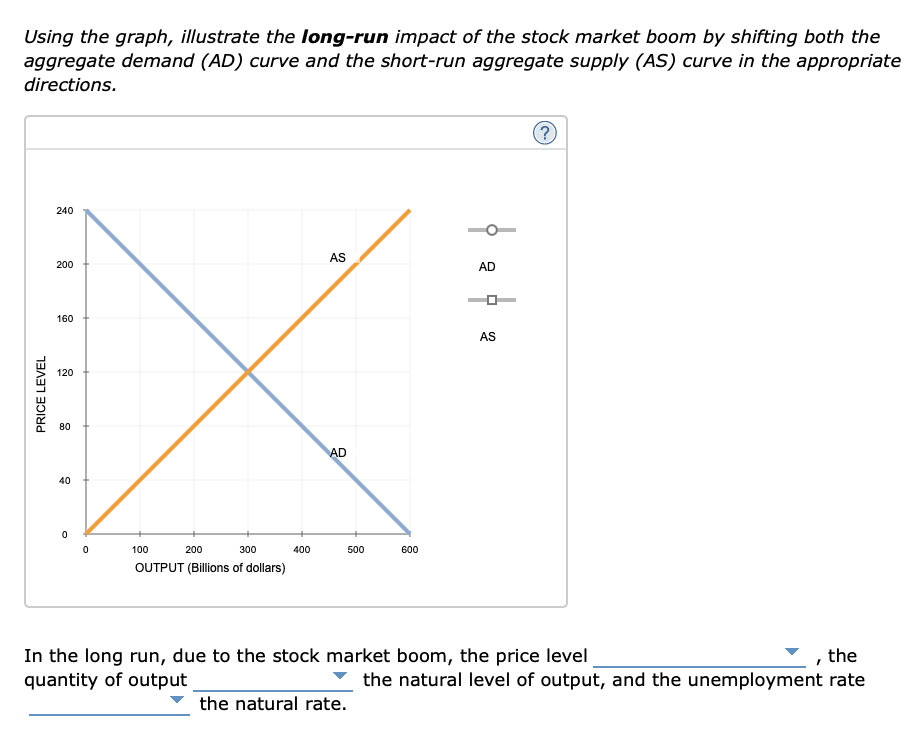
Using the graph, illustrate the long-run impact of the stock market boom by shifting both the aggregate demand \( (A D) \) curve and the short-run aggregate supply (AS) curve in the appropriate directions. In the long run, due to the stock market boom, the price level , the quantity of output the natural level of output, and the unemployment rate the natural rate.
Expert Answer
Economic Fluctuations : Economic fluctuations are changes in n

