Home /
Expert Answers /
Economics /
the-following-graph-plots-the-short-run-phillips-curve-for-a-hypothetical-economy-the-given-point-pa151
(Solved): The following graph plots the short-run Phillips curve for a hypothetical economy. The given point ...
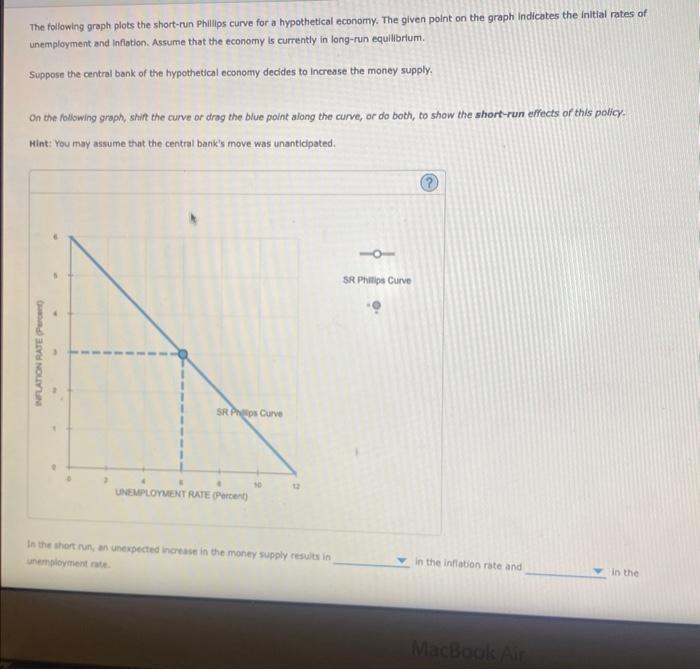
The following graph plots the short-run Phillips curve for a hypothetical economy. The given point on the graph indicates the initial rates of unemployment and inflotion. Assume that the economy is currently in long-run equilibrium. Suppose the central bank of the hypothetical economy dedides to increase the money supply. On the following groph, shit the curve or drag the blue point along the curve, or do both, to show the short-run effects of this policy. Hint: You may assume that the central bank's move was unanticipated. In the short run, an unexpected increase in the money supply results in unemployment rate.
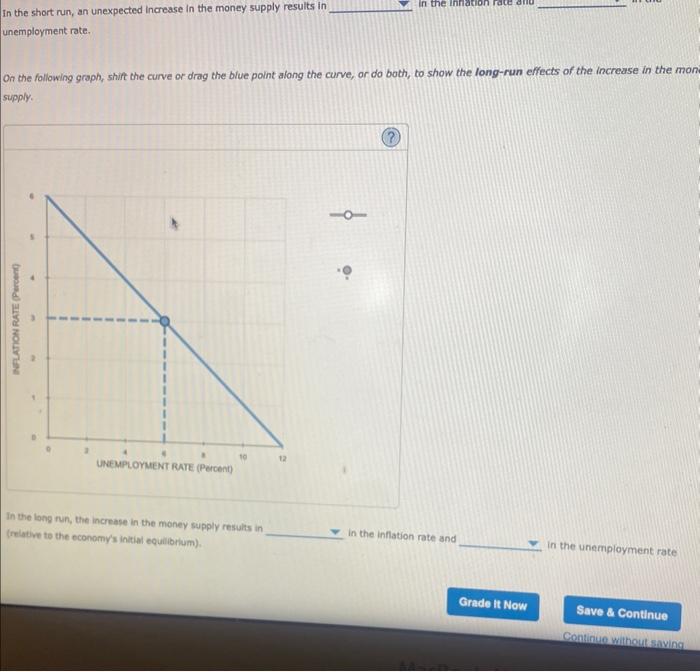
in the short run, an unexpected increase in the money supply results in unemployment rate. On the following graph, shift the curve or drag the blue point along the curve, or do both, to show the long-run effects of the increase in the mon supply. In the long tun, the increase in the money supply results in (relative to the economy's initim equilibrlum). in the inflation rate and in the unemployment rate
Expert Answer
The Phillips curve (PC) shows the negative relationship between the inflation rate and the unemployment rate (As shown in the graph, short-run PC is sloping downward).The above definition is for short-run PC, because in short-run it is assumed that the inflation rate is unanticipated.However, in the long run, as labor anticipates the change in inflation, therefore they adjust their price (or wage) accordingly. therefore, Long-run PC is generally a straight vertical line (as shown in the graph below).