Home /
Expert Answers /
Economics /
the-following-graph-plots-the-short-run-and-long-run-phillips-curves-srpc-and-lrpc-respectively-pa748
(Solved): The following graph plots the short-run and long-run Phillips curves (SRPC and LRPC, respectively) ...
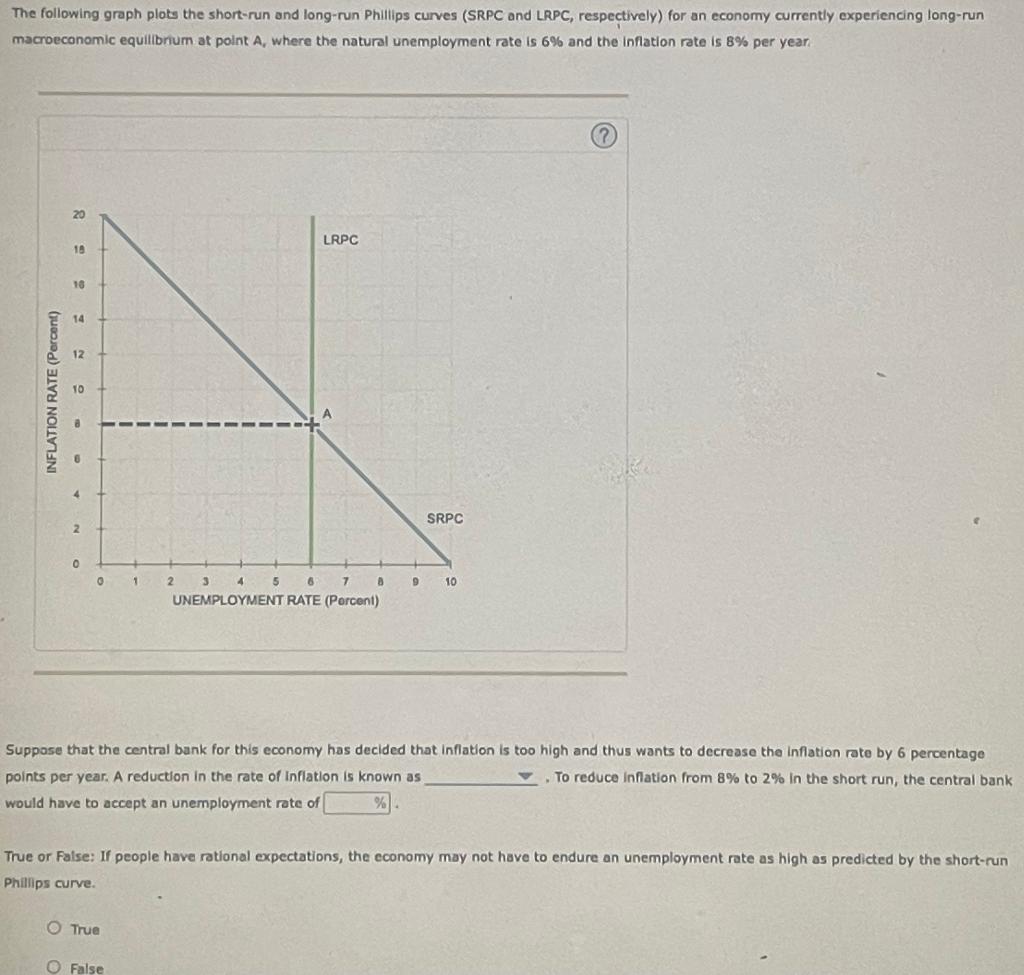
The following graph plots the short-run and long-run Phillips curves (SRPC and LRPC, respectively) for an economy currently experiencing long-run macroeconomic equilibrium at polnt , where the natural unemployment rate is and the inflation rate is per year. Suppose that the central bank for this economy has decided that inflation is too high and thus wants to decrease the inflation rate by 6 percentage points per year. A reduction in the rate of Infiation is known as would have to accept an unemployment rate of True or False: If people have rational expectations, the cconomy may not have to endure an unemployment rate as high as predicted by the short-run Phillips curve. True
Expert Answer
Given in the question that a graph which plots the short-run and long-run Phillips curves (SRPC and LRPC, respectively) for an economy currently experiencing long-run macroeconomic equilibrium at point A, where the natural unemployment rate is 6% and the inflation rate is 8% per year.