Home /
Expert Answers /
Economics /
the-following-graph-plots-the-marginal-cost-mc-curve-average-total-cost-atc-curve-and-average-pa239
(Solved): The following graph plots the marginal cost (MC) curve, average total cost (ATC) curve, and average ...
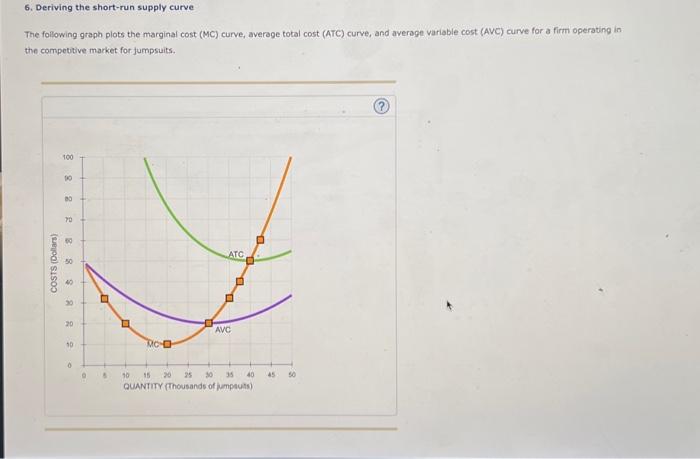
The following graph plots the marginal cost (MC) curve, average total cost (ATC) curve, and average wariable cost (AvC) curve for a firm operating in the competitive market for fumpsuits.
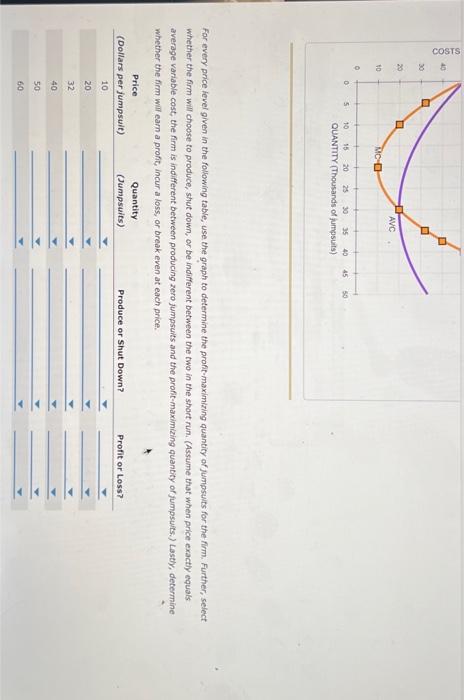
For every price fovel given in the following table, use the graph to determine the profit-maximizing quantity of jumpsuits for the-firm, Further, select whether the firm will choose to produce, shut down, or be indifferent between the two in the short run. (Assume that when price exactly equals average variable cost, the firm is indifferent between producing zero jumpsuits and the profit-maximizing quantity of jumpsuits.) Lasty, determine whether the firm wil earn a profit, incur a loss, or break even at each price.
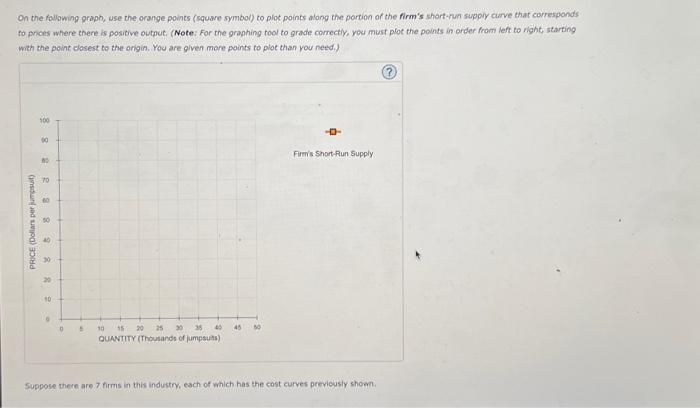
On the following graph, use the orange points (squave symbol) to plot points alang the partion of the firm's shart-4un suppiy curve that colresponds to phats where there is positive output. (Note: For the graphing tool to grade correctiy, you must plot the points in order from left to right, starting with the point dosest to the origin. You are given more points to plot than you need, ) Suppose there are 7 firms in this industry, esch of which has the cost curves previously shom.
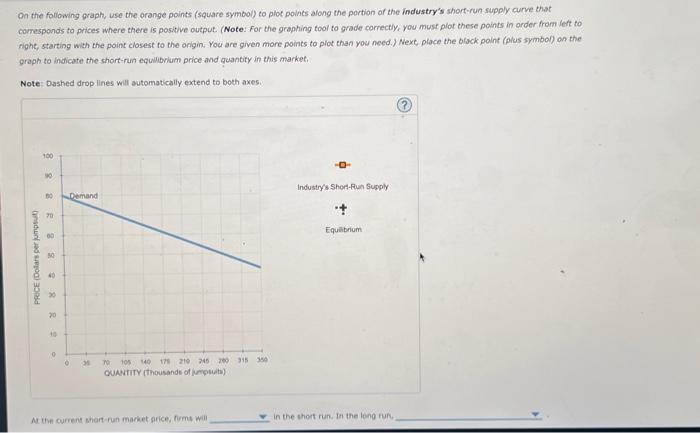
On the following graph, use the orange points (square symbol) to plot poines along the portion of the industry's short-run supply curve that comesponds to prices where there is positive output. (Note: For the graphing tool to grade correctly, you must plot these points in arder from lert to Fight, starting with the point closest to the origin, You are given more points to plot than you necd.) Next, place the bisck polint (alus symbol) on the graph to inolicate the short-run equilibrium price and guantity in this market. Note: Dashed drop lines will automatically extend to both axes. Ar tikn current short run inarket grice, firms wiil in the thont runs, in the leng rurt,
Expert Answer
In a competitive market, a firm produces where P = MC i.e. supply curve of the firm is same as its marginal cost curve (above minimum average variable cost = $ 20)Using the above table points, we can draw the firm's SR supply:A firm would produce where price is greater than or equal to the shutdown price (= min AVC = $ 20). Further, it would make profit when Price is greater than Average total cost.Profit = (Price - ATC) Quantity