Home /
Expert Answers /
Economics /
the-following-graph-is-the-production-function-for-a-firm-using-only-one-variable-factor-of-produc-pa683
(Solved): The following graph is the production function for a firm using only one variable factor of produc ...
![\[
(300,1.5)
\]
After plotting the final point of your multipoint curve, press the Esc key on your keyboard to end the line.](https://media.cheggcdn.com/media/f9b/f9b2d6ff-c7a4-4471-9575-da1e34f1a260/phpoQP5FY)
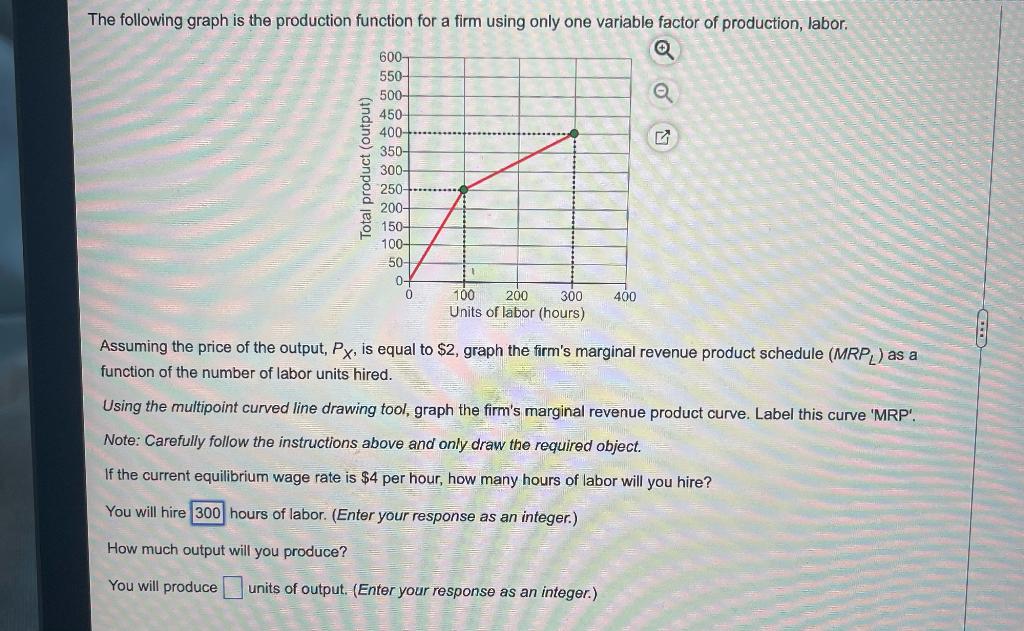
The following graph is the production function for a firm using only one variable factor of production, labor. Assuming the price of the output, \( P_{X} \), is equal to \( \$ 2 \), graph the firm's marginal revenue product schedule \( \left(M R P_{L}\right) \) as a function of the number of labor units hired. Using the multipoint curved line drawing tool, graph the firm's marginal revenue product curve. Label this curve 'MRP'. Note: Carefully follow the instructions above and only draw the required object. If the current equilibrium wage rate is \( \$ 4 \) per hour, how many hours of labor will you hire? You will hire hours of labor. (Enter your response as an integer.) How much output will you produce? You will produce units of output. (Enter your response as an integer.)
\[ (300,1.5) \] After plotting the final point of your multipoint curve, press the Esc key on your keyboard to end the line.
Expert Answer
From the given total product curve, we get the marginal product ,marginal revenue product as shown in the below t