Home /
Expert Answers /
Economics /
the-following-graph-illustrates-the-market-for-large-moving-trucks-in-eugene-or-during-oregon-39-s-f-pa173
(Solved): The following graph illustrates the market for large moving trucks in Eugene, OR, during Oregon's f ...
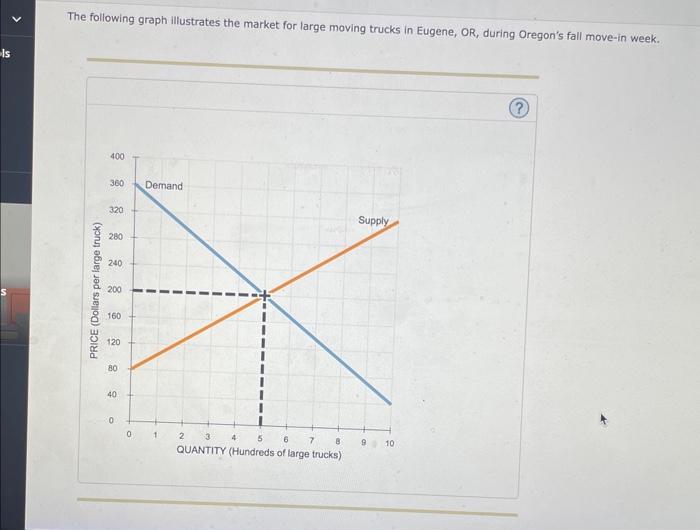
The following graph illustrates the market for large moving trucks in Eugene, OR, during Oregon's fall move-in week.
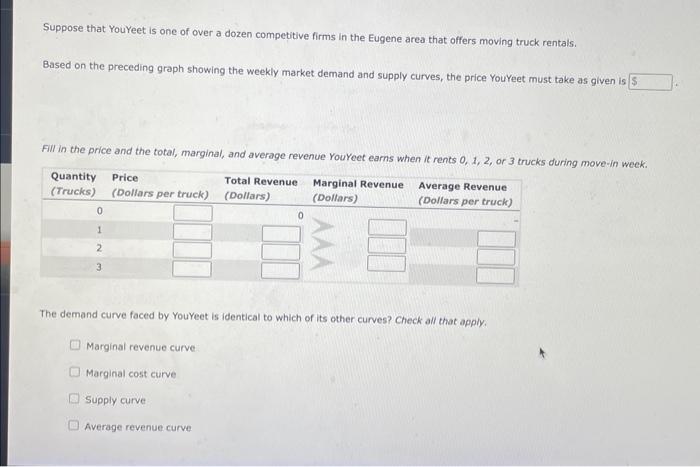
Suppose that YouYeet is one of over a dozen competitive firms in the Eugene area that offers moving truck rentals. Based on the preceding graph showing the weekly market demand and supply curves, the price YouYeet must take as given is Fill in the price and the total, marginal, and average revenue YouYeet earns when it rents \( 0,1,2 \), or 3 trucks during move-in week. The demand curve faced by YouYeet is identical to which of its other curves? Check all that apply. Marginal revenue curve Marginal cost curve Supply curve Average revenue curve
Expert Answer
(Part 1) The price that the firm takes is the Market equilibrium price. Firm's price = $200