Home /
Expert Answers /
Economics /
the-following-graph-gives-the-demand-d-curve-for-water-services-in-the-fictional-town-of-streamsh-pa273
(Solved): The following graph gives the demand (D) curve for water services in the fictional town of Streamsh ...
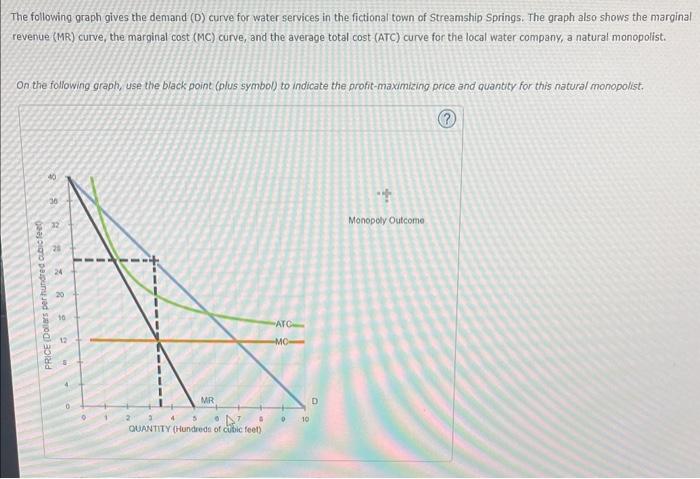
The following graph gives the demand (D) curve for water services in the fictional town of Streamship Springs. The graph also shows the marginal revenue (MR) curve, the marginal cost (MC) curve, and the average total cost (ATC) curve for the local water company, a natural monopolist. On the following graph, use the black point (plus symbol) to indicate the profit-maximizing price and quantity for this natural monopolist.
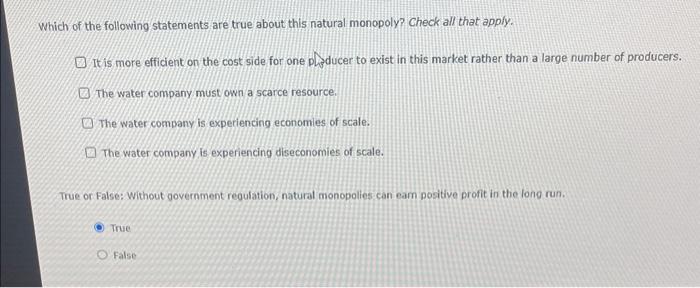
Which of the following statements are true about this natural monopoly? Check all that apply. It is more efficient on the cost side for one plsducer to exist in this market rather than a large number of producers. The water company must own a scarce resource. The water company is experiencing economies of scale. The water company is experiencing diseconomies of scale. True or False: without government regulation, natural monopolies can eam positive profit in the long run. True False
Expert Answer
Natural monopoly is a market situat