Home /
Expert Answers /
Economics /
the-following-graph-gives-the-demand-d-curve-for-5-mathrm-g-lte-services-in-the-fictiona-pa910
(Solved): The following graph gives the demand (D) curve for \( 5 \mathrm{G} \) LTE services in the fictiona ...
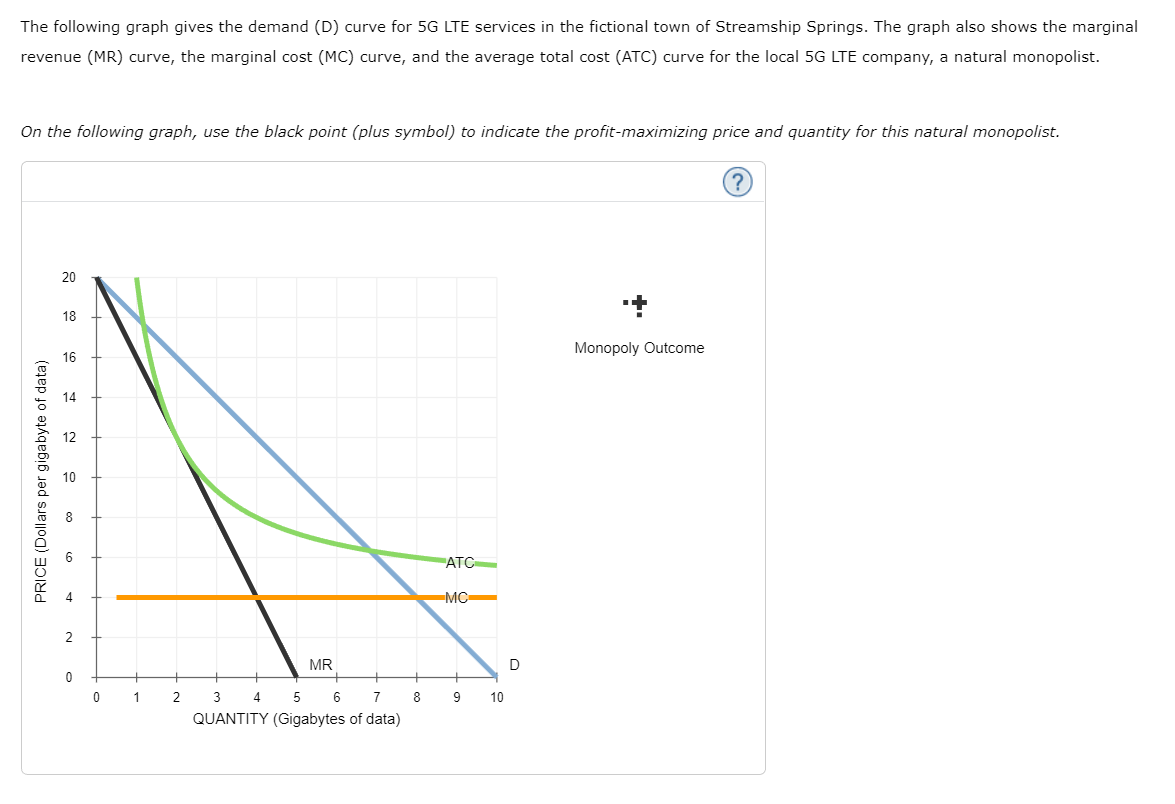
The following graph gives the demand (D) curve for \( 5 \mathrm{G} \) LTE services in the fictional town of Streamship Springs. The graph also shows the marginal revenue (MR) curve, the marginal cost (MC) curve, and the average total cost (ATC) curve for the local 5G LTE company, a natural monopolist. On the following graph, use the black point (plus symbol) to indicate the profit-maximizing price and quantity for this natural monopolist.
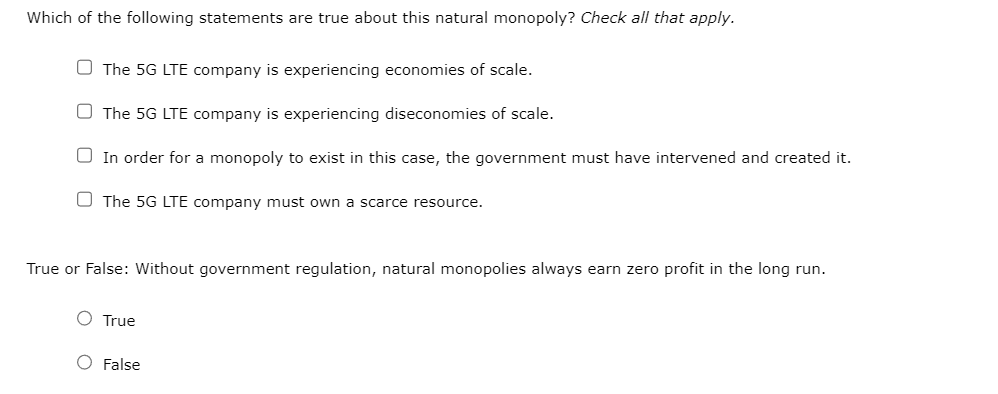
The \( 5 \mathrm{G} \) LTE company is experiencing economies of scale. The \( 5 \mathrm{G} \) LTE company is experiencing diseconomies of scale. In order for a monopoly to exist in this case, the governmen The 5G LTE company must own a scarce resource. Ise: Without government regulation, natural monopolies alw: True False
Expert Answer
Part 1. Monopoly outcome is at