Home /
Expert Answers /
Economics /
the-following-graph-depicts-the-mpc-and-msc-of-the-robot-factory-production-the-robot-market-is-co-pa290
(Solved): The following graph depicts the MPC and MSC of the robot factory production. The robot market is co ...
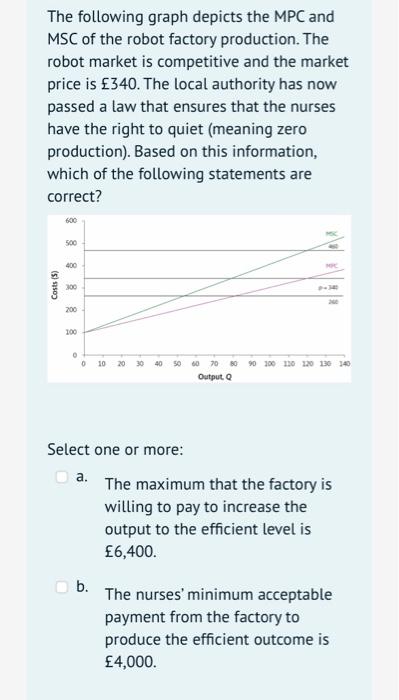
The following graph depicts the MPC and MSC of the robot factory production. The robot market is competitive and the market price is \( £ 340 \). The local authority has now passed a law that ensures that the nurses have the right to quiet (meaning zero production). Based on this information, which of the following statements are correct? Select one or more: a. The maximum that the factory is willing to pay to increase the output to the efficient level is \( £ 6,400 \). b. The nurses' minimum acceptable payment from the factory to produce the efficient outcome is \( £ 4,000 \).
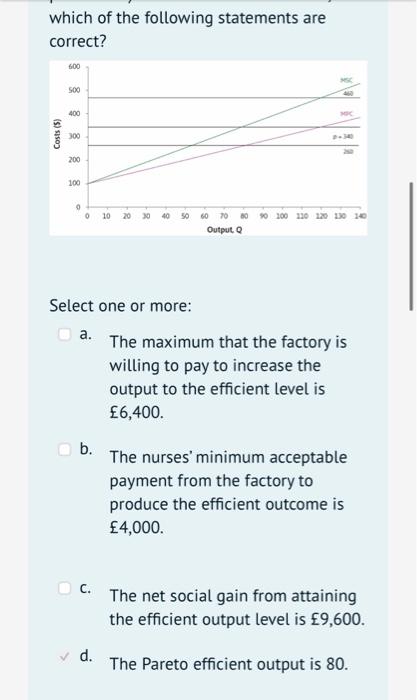
which of the following statements are correct? Select one or more: a. The maximum that the factory is willing to pay to increase the output to the efficient level is \( £ 6,400 \). b. The nurses' minimum acceptable payment from the factory to produce the efficient outcome is \( £ 4,000 \). c. The net social gain from attaining the efficient output level is \( £ 9,600 \). d. The Pareto efficient output is 80 .
Expert Answer
Question: The correct Answers