Home /
Expert Answers /
Statistics and Probability /
the-following-frequency-histogram-represents-the-iq-scores-of-a-random-sample-of-seventh-grade-stud-pa341
(Solved): The following frequency histogram represents the IQ scores of a random sample of seventh-grade stud ...
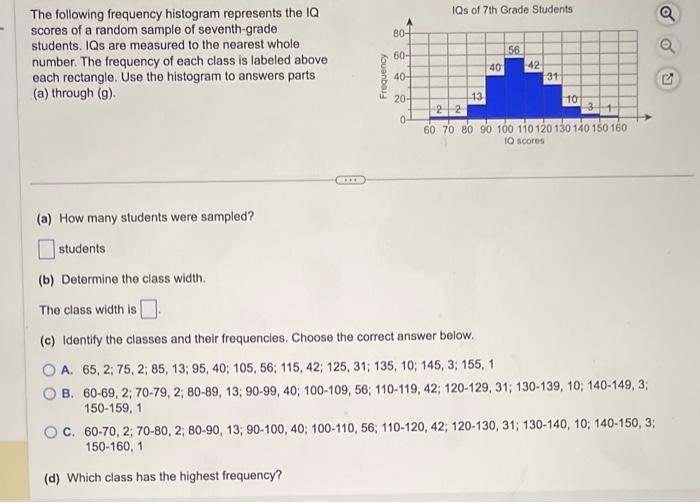
The following frequency histogram represents the IQ scores of a random sample of seventh-grade students. IQs are measured to the nearest whole number. The frequency of each class is labeled above each rectangle. Use the histogram to answers parts (a) through ( \( g \) ). (a) How many students were sampled? students (b) Determine the class width. The class width is (c) Identify the classes and their frequencies. Choose the correct answer below. A. 65,\( 2 ; 75,2 ; 85,13 ; 95,40 ; 105,56 ; 115,42 ; 125,31 ; 135,10 ; 145,3 ; 155,1 \) B. \( 60-69,2 ; 70-79,2 ; 80-89,13 ; 90-99,40 ; 100-109,56 ; 110-119,42 ; 120-129,31 ; 130-139,10 ; 140-149,3 ; \) 150-159, 1 C. \( 60-70,2 ; 70-80,2 ; 80-90,13 ; 90-100,40 ; 100-110,56 ; 110-120,42 ; 120-130,31 ; 130-140,10 ; 140-150,3 \); 150-160, 1 (d) Which class has the highest frequency?
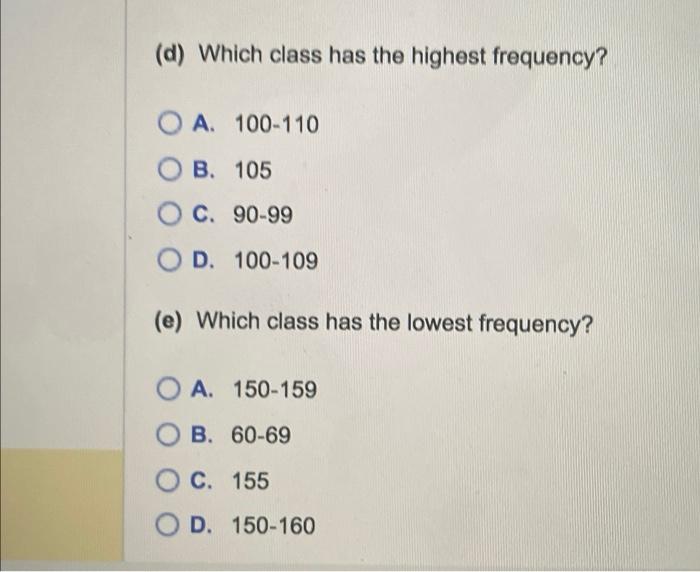
(d) Which class has the highest frequency? A. 100-110 B. 105 C. \( 90-99 \) D. 100-109 (e) Which class has the lowest frequency? A. 150-159 B. \( 60-69 \) C. 155 D. 150-160
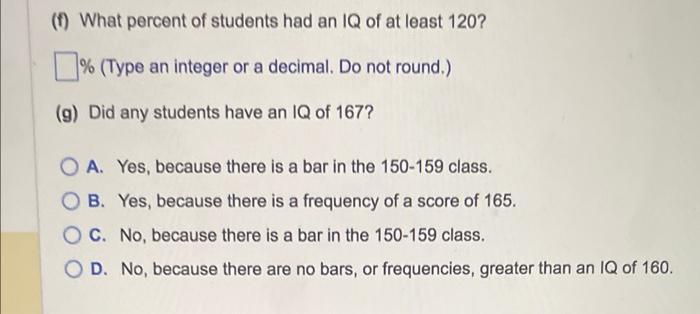
(f) What percent of students had an IQ of at least \( 120 ? \) \% (Type an integer or a decimal. Do not round.) (g) Did any students have an IQ of \( 167 ? \) A. Yes, because there is a bar in the 150-159 class. B. Yes, because there is a frequency of a score of 165. C. No, because there is a bar in the 150-159 class. D. No, because there are no bars, or frequencies, greater than an IQ of 160.
Expert Answer
Solution: (a) Total number of student were sampled n=2+2+13+40+56+42+31+10+3+1=200 Students The class width is =80?70=10