Home /
Expert Answers /
Biology /
the-following-diagram-shows-the-atp-hydrolysis-reaction-during-atp-hydrolysis-the-phosphoanhydrid-pa234
(Solved): The following diagram shows the ATP hydrolysis reaction. During ATP hydrolysis, the phosphoanhydrid ...
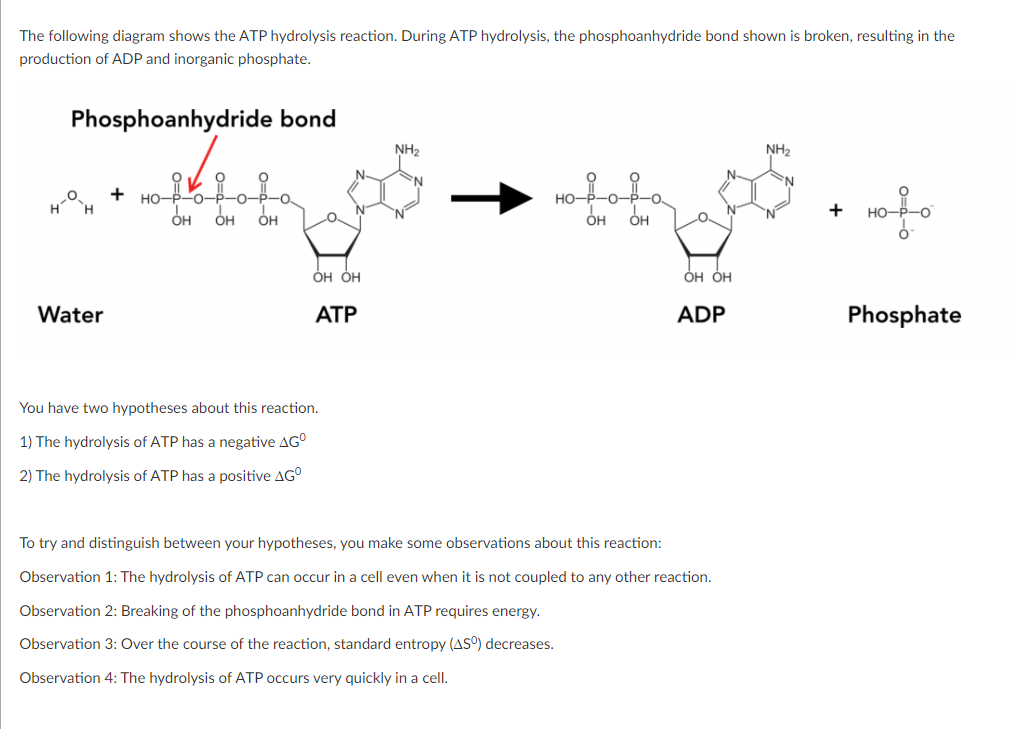
The following diagram shows the ATP hydrolysis reaction. During ATP hydrolysis, the phosphoanhydride bond shown is broken, resulting in the production of ADP and inorganic phosphate. Phosphoanhydride bond Water ADP Phosphate You have two hypotheses about this reaction. 1) The hydrolysis of ATP has a negative 2) The hydrolysis of ATP has a positive To try and distinguish between your hypotheses, you make some observations about this reaction: Observation 1: The hydrolysis of ATP can occur in a cell even when it is not coupled to any other reaction. Observation 2: Breaking of the phosphoanhydride bond in ATP requires energy. Observation 3: Over the course of the reaction, standard entropy decreases. Observation 4: The hydrolysis of ATP occurs very quickly in a cell.
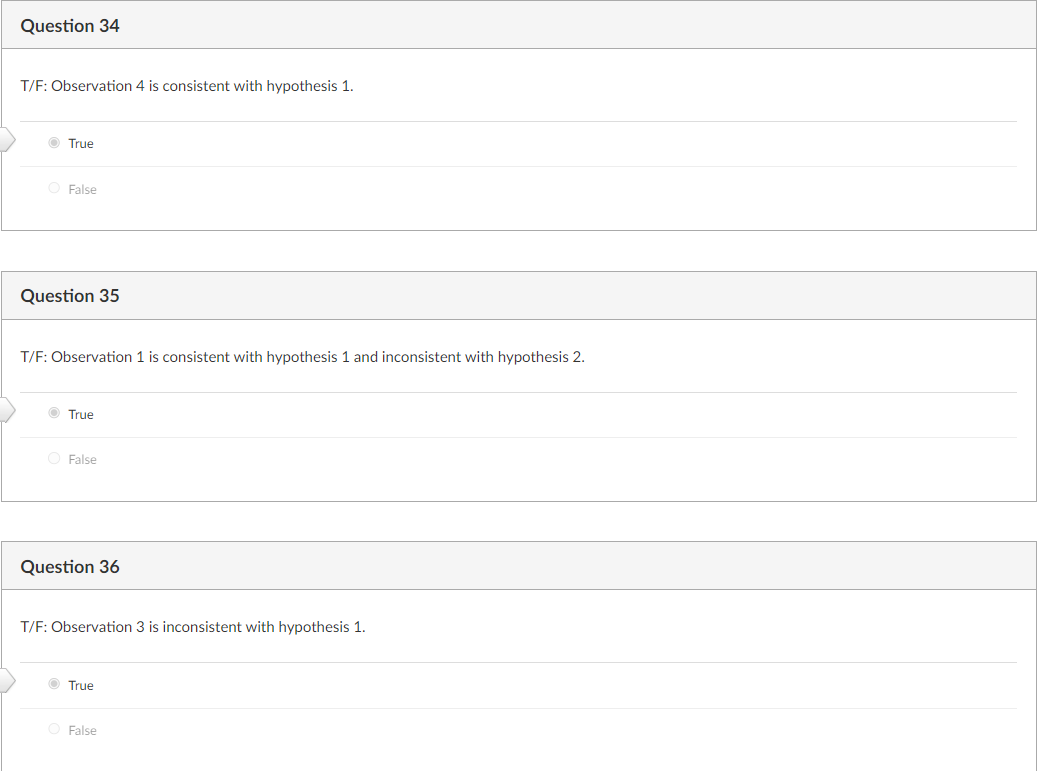
T/F: Observation 4 is consistent with hypothesis 1. True False Question 35 T/F: Observation 1 is consistent with hypothesis 1 and inconsistent with hypothesis 2. True False Question 36 T/F: Observation 3 is inconsistent with hypothesis 1. True False