Home /
Expert Answers /
Operations Management /
the-following-diagram-shows-a-4-step-process-that-begins-with-operation-1-and-ends-with-operation-4-pa539
(Solved): The following diagram shows a 4-step process that begins with Operation 1 and ends with Operation 4 ...
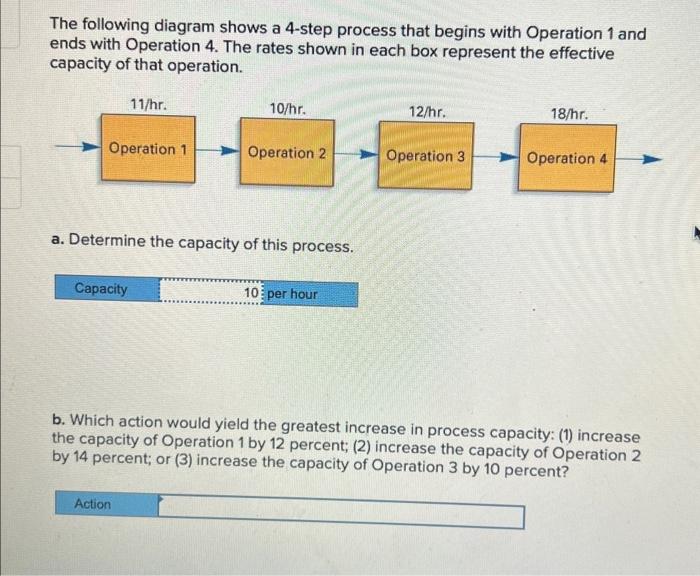
The following diagram shows a 4-step process that begins with Operation 1 and ends with Operation 4. The rates shown in each box represent the effective capacity of that operation. a. Determine the capacity of this process. b. Which action would yield the greatest increase in process capacity: (1) increase the capacity of Operation 1 by 12 percent; (2) increase the capacity of Operation 2 by 14 percent; or (3) increase the capacity of Operation 3 by 10 percent?
Expert Answer
Answer b : Action (3) increase the capacity of Operation 3 by 10 percent would yield the greatest increase in process capacity. We need to co