Home /
Expert Answers /
Electrical Engineering /
the-figure-below-shows-13-peaks-of-the-qrs-complex-from-an-ecg-exam-calculate-and-report-explici-pa184
(Solved): The figure below shows 13 peaks of the QRS complex from an ECG exam. calculate and report explici ...
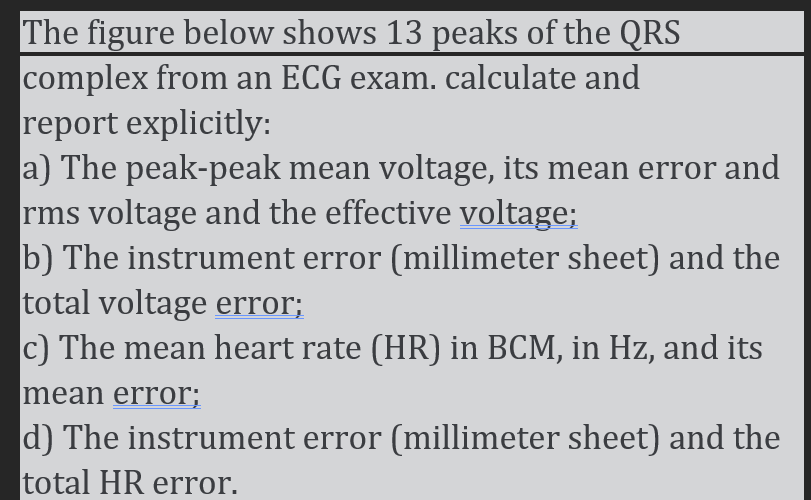
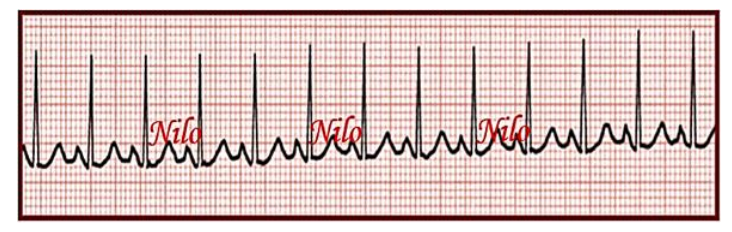
The figure below shows 13 peaks of the QRS complex from an ECG exam. calculate and report explicitly: a) The peak-peak mean voltage, its mean error and rms voltage and the effective voltage; b) The instrument error (millimeter sheet) and the total voltage error; c) The mean heart rate (HR) in \( \mathrm{BCM} \), in \( \mathrm{Hz} \), and its mean error; d) The instrument error (millimeter sheet) and the total HR error.