(Solved): The energy-level diagram for the atomic emission spectra of an unknown gas is presented in the diagr ...
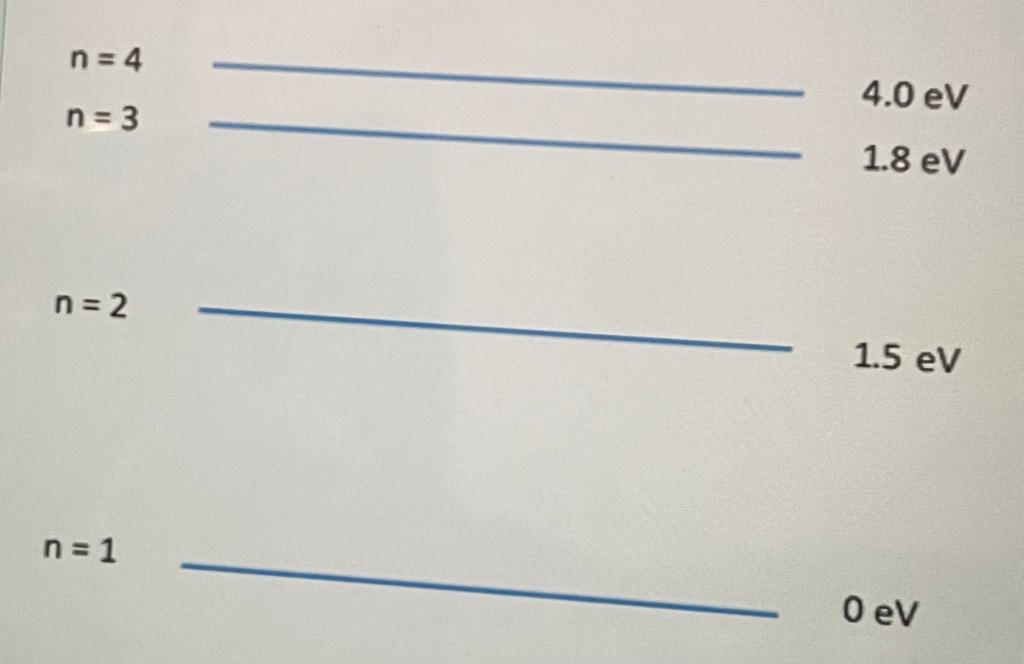
The energy-level diagram for the atomic emission spectra of an unknown gas is presented in the diagram below.
Initially, electrons are only in the ground state (n=1). A beam of red light hits the gas. This beam is a continuous spectrum of red light (from 620 nmnm to 750 nmnm)
How many absorption line/s will there be in the spectra?
|
1 |
Initially, electrons are only in the ground state (n=1). A beam of red light hits the gas. This beam is a continuous spectrum of red light (from 620 nmnm to 750 nmnm)
Calculate the wavelength of the absorption line
|
λ = |
690 |
nmnm |
Calculate the wavelength of the emission lines. Enter from smallest wavelength to largest wavelength (or highest energy to lowest energy). Separate each answer by a comma.
ANSWER 3RD QUESTION!!!!!!!!!!!!!!!!!!
Expert Answer
For the emission wavelength from n=4 to n=1 we get- For the emission wavelength from n=3 to n=1 we get- For the emission wavelength from n=2 to n=1 we get- Using the above given formula we have calculated all the values