Home /
Expert Answers /
Economics /
the-diagram-above-shows-the-production-possibilities-curves-for-two-countries-artland-and-ray-pa959
(Solved): The diagram above shows the production possibilities curves for two countries: Artland and Ray ...
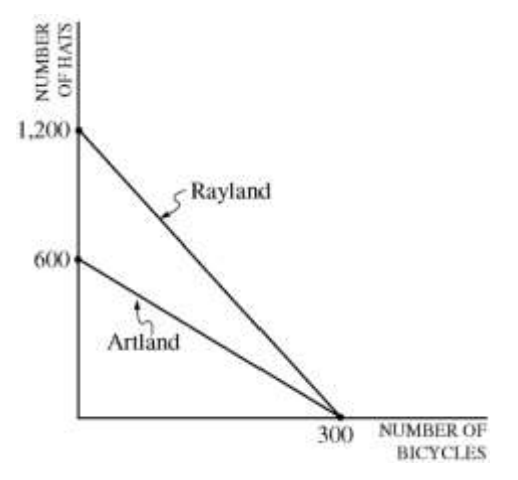
The diagram above shows the production possibilities curves for two countries: Artland and Rayland. Using equal amounts of resources, Artland can produce 600 hats or 300 bicycles, whereas Rayland can produce 1,200 hats or 300 bicycles.
(a) Calculate the opportunity cost of a bicycle in Rayland.
(b) If the two countries specialize and trade, which country will export bicycles? Explain.
(c) If the terms of trade are 3 hats for 1 bicycle, would trade be advantageous for each of the following?
(i) Artland
(ii) Rayland
(d) If productivity in Artland doubles, which country has the comparative advantage in the production of bicycles?
