Home /
Expert Answers /
Trigonometry /
the-bar-graph-shows-the-average-price-of-a-movie-ticket-for-selected-years-from-1980-through-2010-pa757
(Solved): The bar graph shows the average price of a movie ticket for selected years from 1980 through 2010 ...
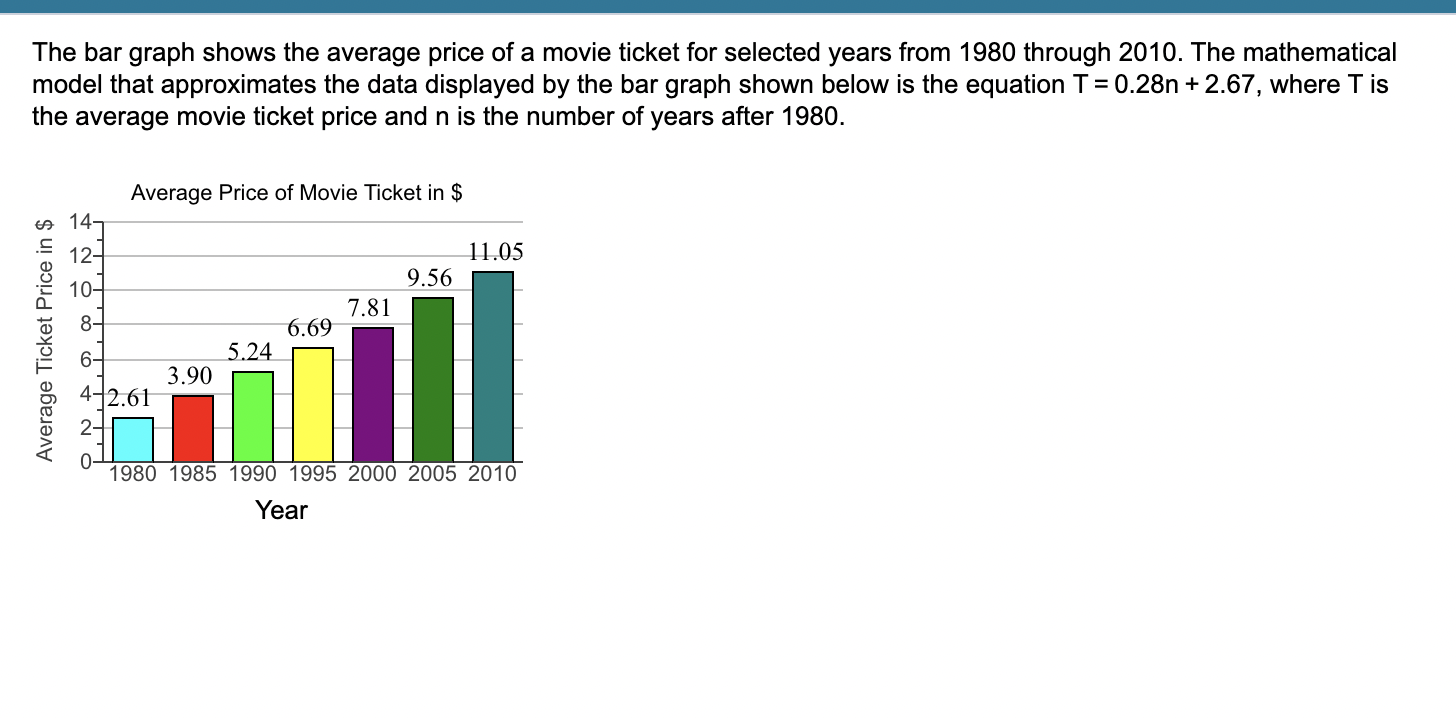
The bar graph shows the average price of a movie ticket for selected years from 1980 through 2010. The mathematical model that approximates the data displayed by the bar graph shown below is the equation T = 0.28n +2.67, where T is the average movie ticket price and n is the number of years after 1980. Average Price of Movie Ticket in $ 11.05 9.56 7.81 6.69 5.24 3.90 2.61 1980 1985 1990 1995 2000 2005 2010 Year Average Ticket Price in $ O.N.
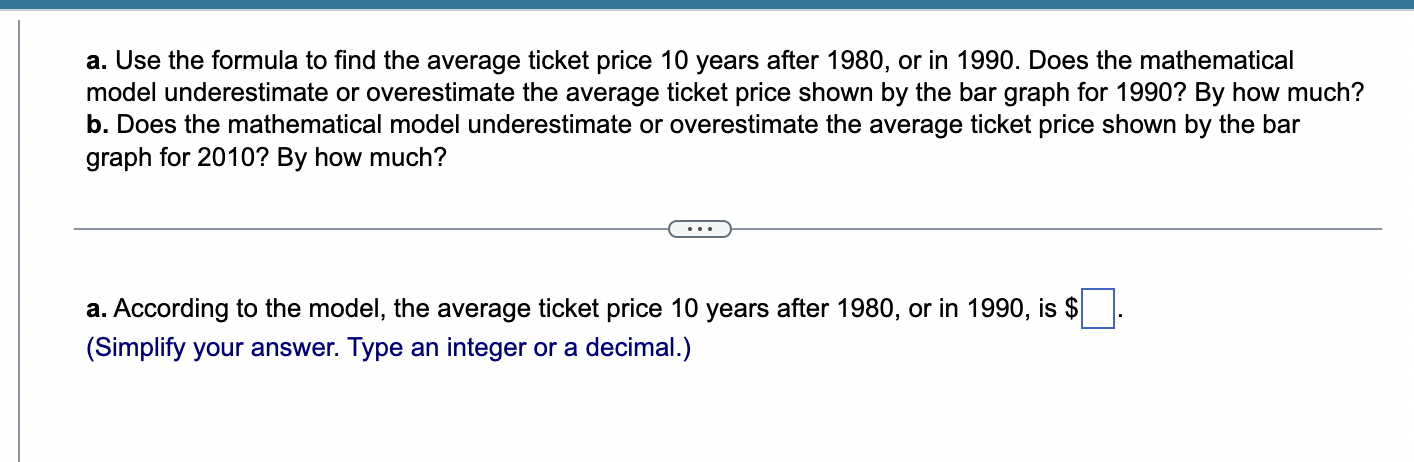
a. Use the formula to find the average ticket price 10 years after 1980, or in 1990. Does the mathematical model underestimate or overestimate the average ticket price shown by the bar graph for 1990? By how much? b. Does the mathematical model underestimate or overestimate the average ticket price shown by the bar graph for 2010? By how much? a. According to the model, the average ticket price 10 years after 1980, or in 1990, is $ (Simplify your answer. Type an integer or a decimal.)