Home /
Expert Answers /
Economics /
the-arrow-on-the-graph-above-shows-the-budget-line-movement-from-mathrm-l-1-to-mathr-pa439
(Solved): The arrow on the graph above shows the budget line movement from \( \mathrm{L}^{1} \) to \( \mathr ...
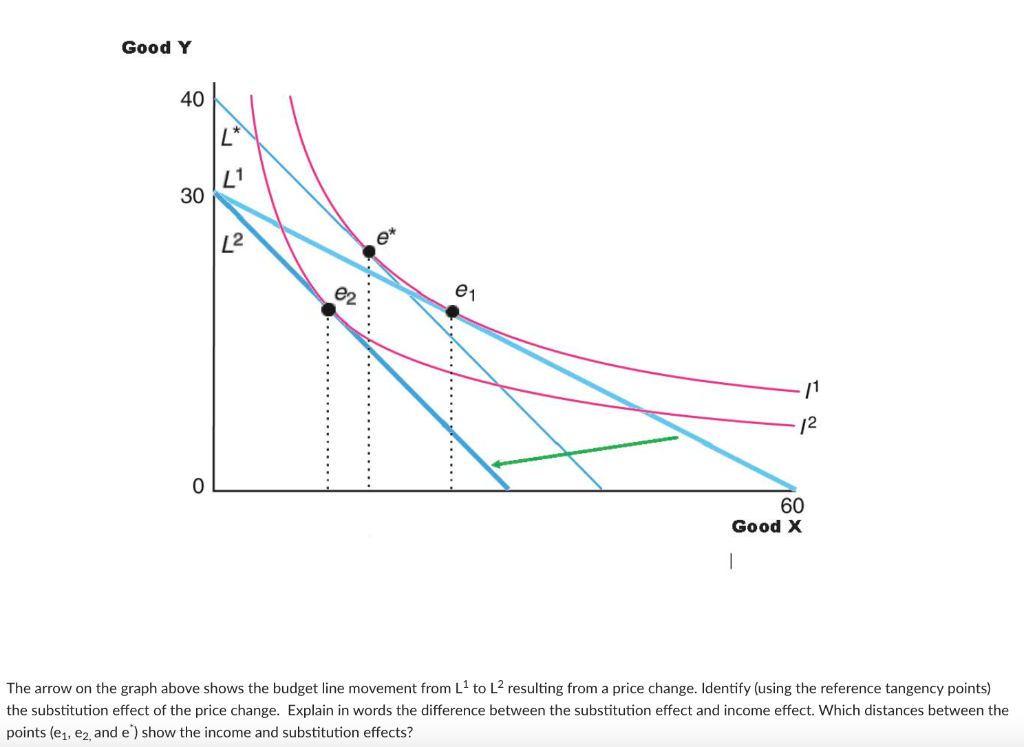
The arrow on the graph above shows the budget line movement from \( \mathrm{L}^{1} \) to \( \mathrm{L}^{2} \) resulting from a price change. Identify (using the reference tangency points) the substitution effect of the price change. Explain in words the difference between the substitution effect and income effect. Which distances between the points ( \( \mathrm{e}_{1}, \mathrm{e}_{2} \), and \( \left.\mathrm{e}^{*}\right) \) show the income and substitution effects?
Expert Answer
Step 1 Substitution effect is the change in the consu