Home /
Expert Answers /
Computer Science /
table-1-orbital-characteristics-for-some-of-the-confirmed-exoplanets-from-the-kepler-mission-tigu-pa753
(Solved): Table 1 -Orbital characteristics for some of the confirmed exoplanets from the Kepler mission. Tigu ...
![Creating Plots
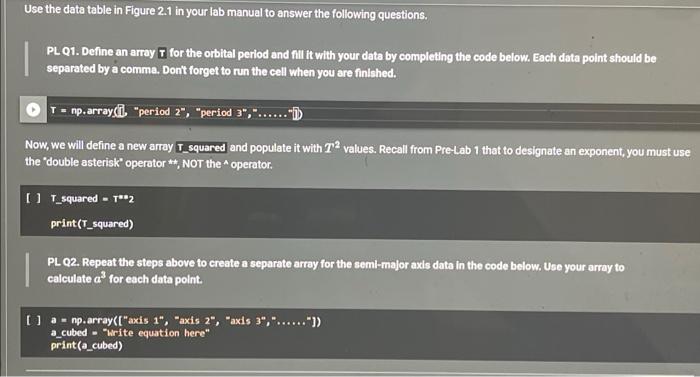
PL Q3. Complete the code below to create a discrete plot of your calculated values.
[] plt,plot(X DATA HERE, Y](https://media.cheggcdn.com/study/4f8/4f85d32d-00d4-4878-8fa4-fd2f1be1c1e2/image)
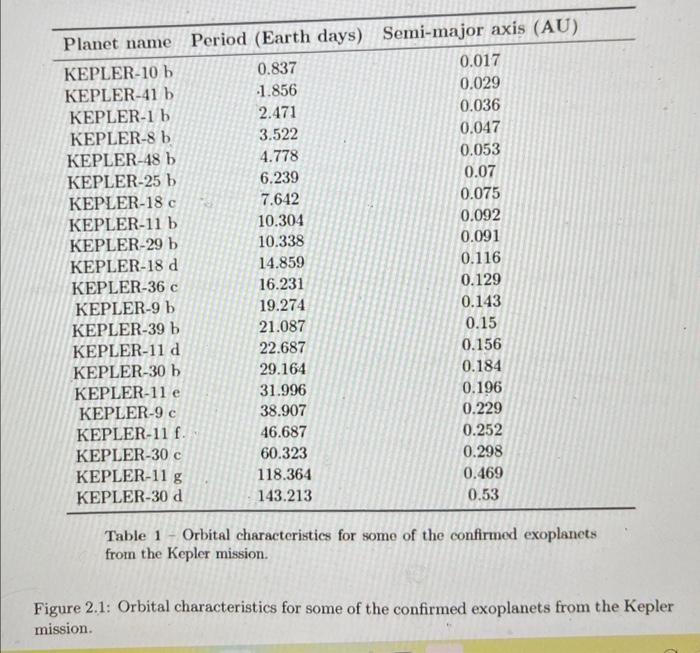
Table 1 -Orbital characteristics for some of the confirmed exoplanets from the Kepler mission. Tigure 2.1: Orbital characteristics for some of the confirmed exoplanets from the Kepler nission.
Use the data table in Figure \( 2.1 \) in your lab manual to answer the following questions. PL Q1. Define an array \( \bar{T} \) for the orbital period and \( n i l \) it with your data by completing the code below. Each data point should be separated by a comma. Don't forget to run the cell when you are finished. \( T=n p \), arrays(i), "period 2", "period 3","....." (iD) Now, we will define a new array \( \boldsymbol{T}_{\text {s squared }} \) and populate it with \( T^{2} \) values. Recall from Pre-Lab 1 that to designate an exponent, you must use the "double asterisk" operator * *, NOT the ^ operator. [] \( T_{-} \)squared \( =T^{m-2} 2 \) print(T__squared) PL Q2. Repeat the steps above to create a separate array for the semi-major axis data in the code below. Use your array to calculate \( a^{3} \) for each data polnt. [ ] a = np.array(["axis 1", "axis 2", "axis 3","...."]) a_cubed = "urite equation here" print(a_cubed)
Creating Plots PL Q3. Complete the code below to create a discrete plot of your calculated values. [] plt,plot(X DATA HERE, Y DATA HERE, 'o') plt. ylabel ("make sure to properly label your \( y \)-axis here") plt. xlabel("make sure to properly label your \( \mathrm{x} \)-axis here") plt.savefig(' Figure_1.png', bbox_inches = "tight")