Home /
Expert Answers /
Earth Sciences /
table-1-given-below-presents-the-results-of-a-conventional-oedometer-consolid-pa923
(Solved): Table 1 given below presents the results of a conventional oedometer consolid ...

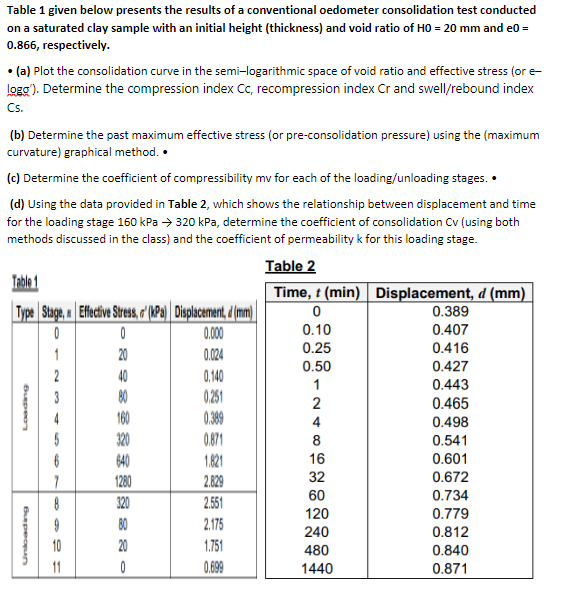
Table 1 given below presents the results of a conventional oedometer consolidation test conducted on a saturated clay sample with an initial height (thickness) and void ratio of \( \mathrm{HO}=20 \mathrm{~mm} \) and \( \mathrm{e} 0= \) \( 0.866 \), respectively. - (a) Plot the consolidation curve in the semi-logarithmic space of void ratio and effective stress (or eloga'). Determine the compression index \( \mathrm{Cc} \), recompression index \( \mathrm{Cr} \) and swell/rebound index Cs. (b) Determine the past maximum effective stress (or pre-consolidation pressure) using the (maximum curvature) graphical method. \( \bullet \) (c) Determine the coefficient of compressibility mv for each of the loading/unloading stages. \( \bullet \) (d) Using the data provided in Table 2, which shows the relationship between displacement and time for the loading stage \( 160 \mathrm{kPa} \rightarrow 320 \mathrm{kPa} \), determine the coefficient of consolidation Cv (using both methods discussed in the class) and the coefficient of permeability \( k \) for this loading stage.
Expert Answer
ANSWER÷ The answer provided below has been developed in a clear step by step manner. The compressibility of the soil takes place in two different meth