Home /
Expert Answers /
Statistics and Probability /
spss-assignment-5-correlation-and-scatterplot-for-both-data-sets-using-spss-1-find-the-correal-pa336
(Solved): SPSS Assignment 5 (Correlation and Scatterplot) For both data sets, using SPSS , 1)find the correal ...
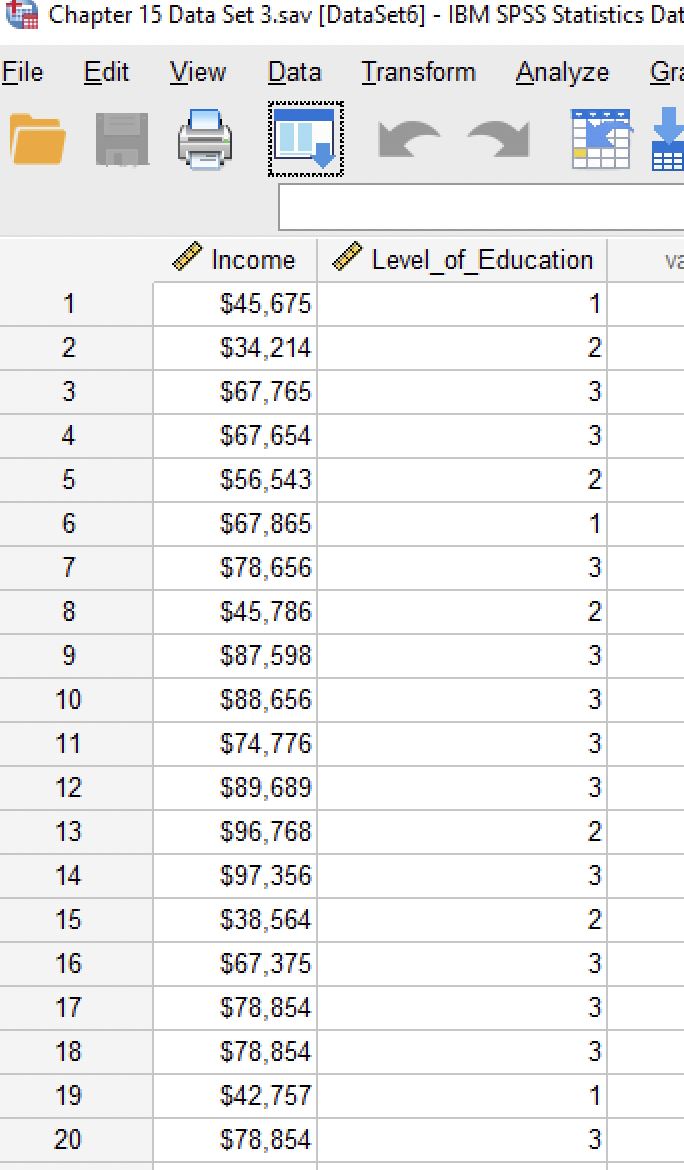
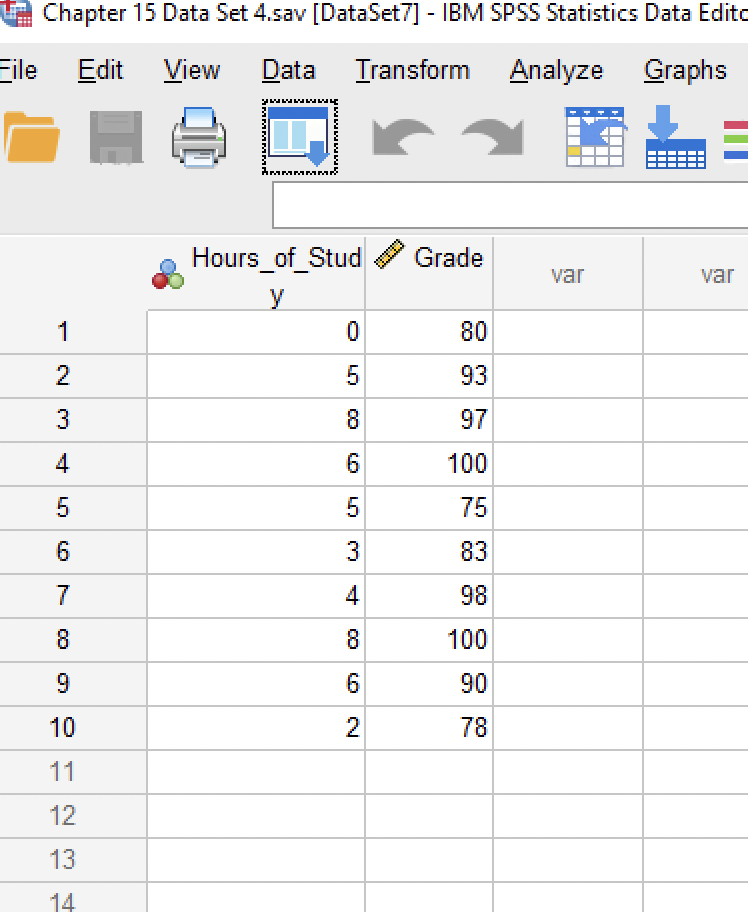
SPSS Assignment 5 (Correlation and Scatterplot) For both data sets, using SPSS , 1)find the correaltion coefficent, 2) decide if correlation is significant at p < 0.05; 3)What is your decision about the null hypothesis? 4) draw the scatterplot. Important: For scatterplots Data Set 3:Use level of education on the X-Axis and income on the Y-axis data set 4: Use hours of study on the x-axis and grade on the y-axis. please include the files from spss