Home /
Expert Answers /
Physics /
some-physics-students-are-studying-periodic-motion-using-an-oscillating-mass-on-a-spring-after-coll-pa143
(Solved): some physics students are studying periodic motion using an oscillating mass on a spring. after coll ...
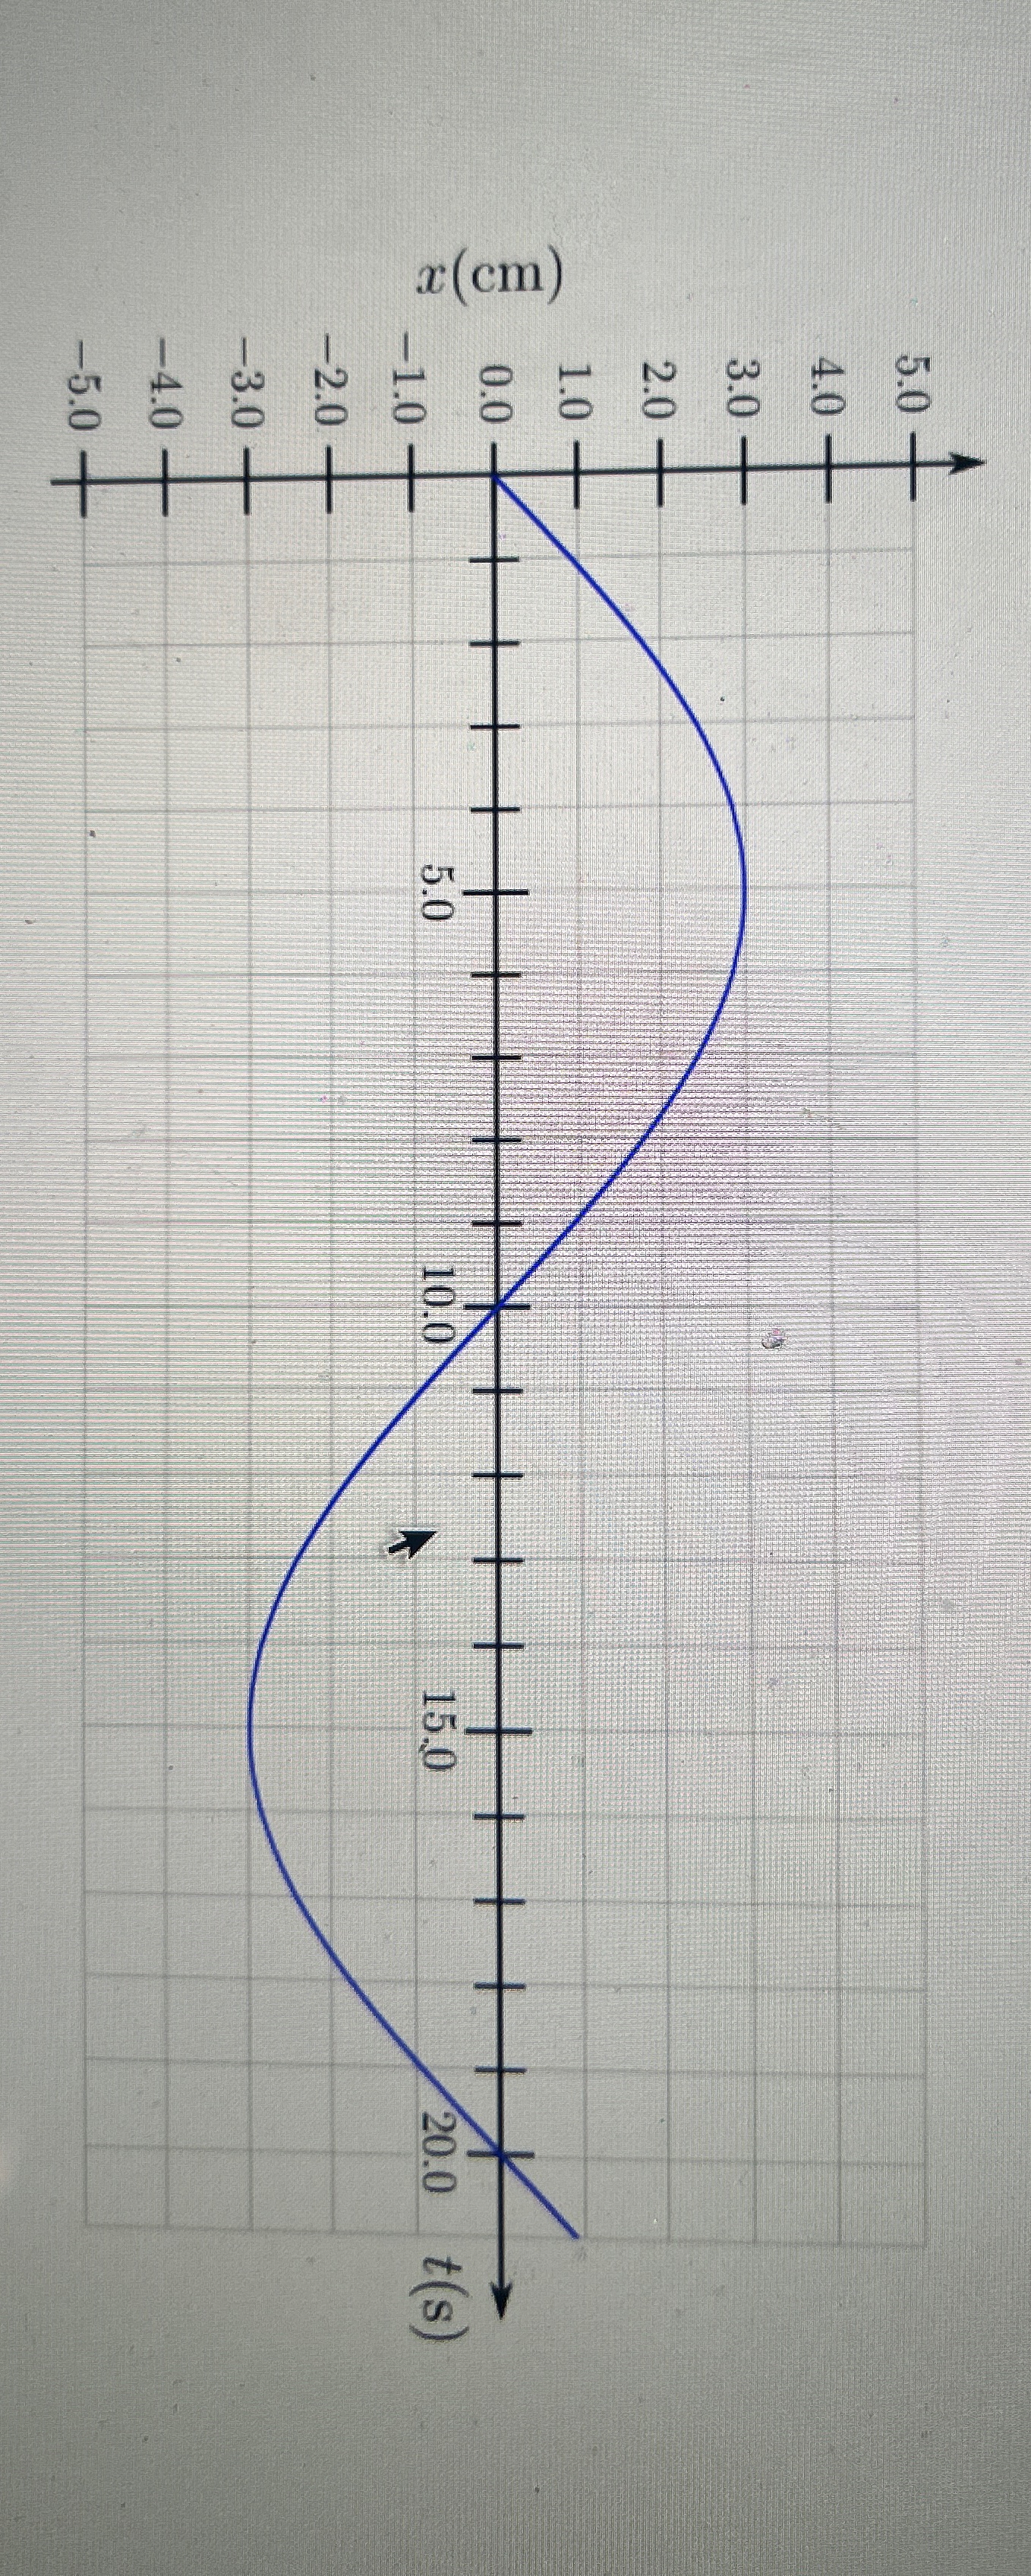
some physics students are studying periodic motion using an oscillating mass on a spring. after collecting the data, they sketched the position versus time graph shown. what is the amplitude? what is the period? the function that represents the data on the graph may be written as
x=At
+\phi with
\phi [0,2\pi )what is the phase constant, in degrees, for the graph presented?