Home /
Expert Answers /
Electrical Engineering /
silicon-has-an-energy-band-diagram-shown-in-figure-2-a-and-a-first-brillouin-zone-shown-in-figure-pa655
(Solved): Silicon has an energy band diagram shown in Figure 2(a) and a first Brillouin zone shown in Figure ...
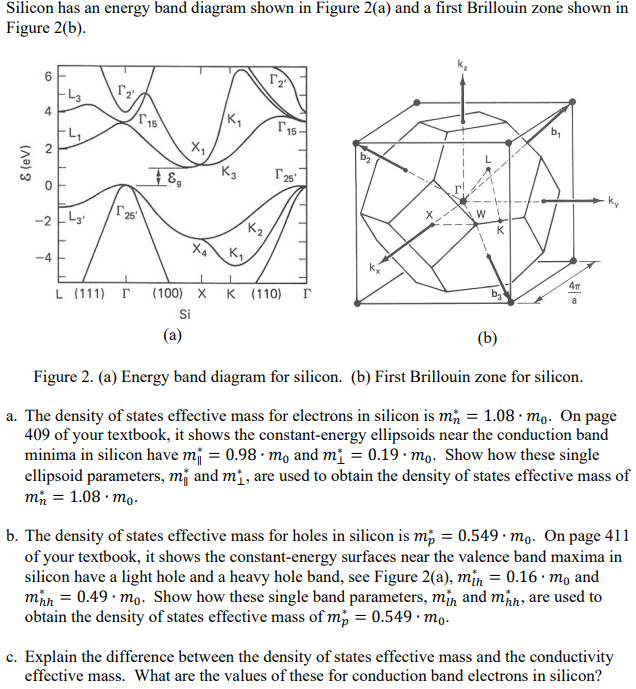
Silicon has an energy band diagram shown in Figure 2(a) and a first Brillouin zone shown in Figure 2(b). (b) Figure 2. (a) Energy band diagram for silicon. (b) First Brillouin zone for silicon. a. The density of states effective mass for electrons in silicon is . On page 409 of your textbook, it shows the constant-energy ellipsoids near the conduction band minima in silicon have and . Show how these single ellipsoid parameters, and , are used to obtain the density of states effective mass of . b. The density of states effective mass for holes in silicon is . On page 411 of your textbook, it shows the constant-energy surfaces near the valence band maxima in silicon have a light hole and a heavy hole band, see Figure and . Show how these single band parameters, and , are used to obtain the density of states effective mass of . c. Explain the difference between the density of states effective mass and the conductivity effective mass. What are the values of these for conduction band electrons in silicon?