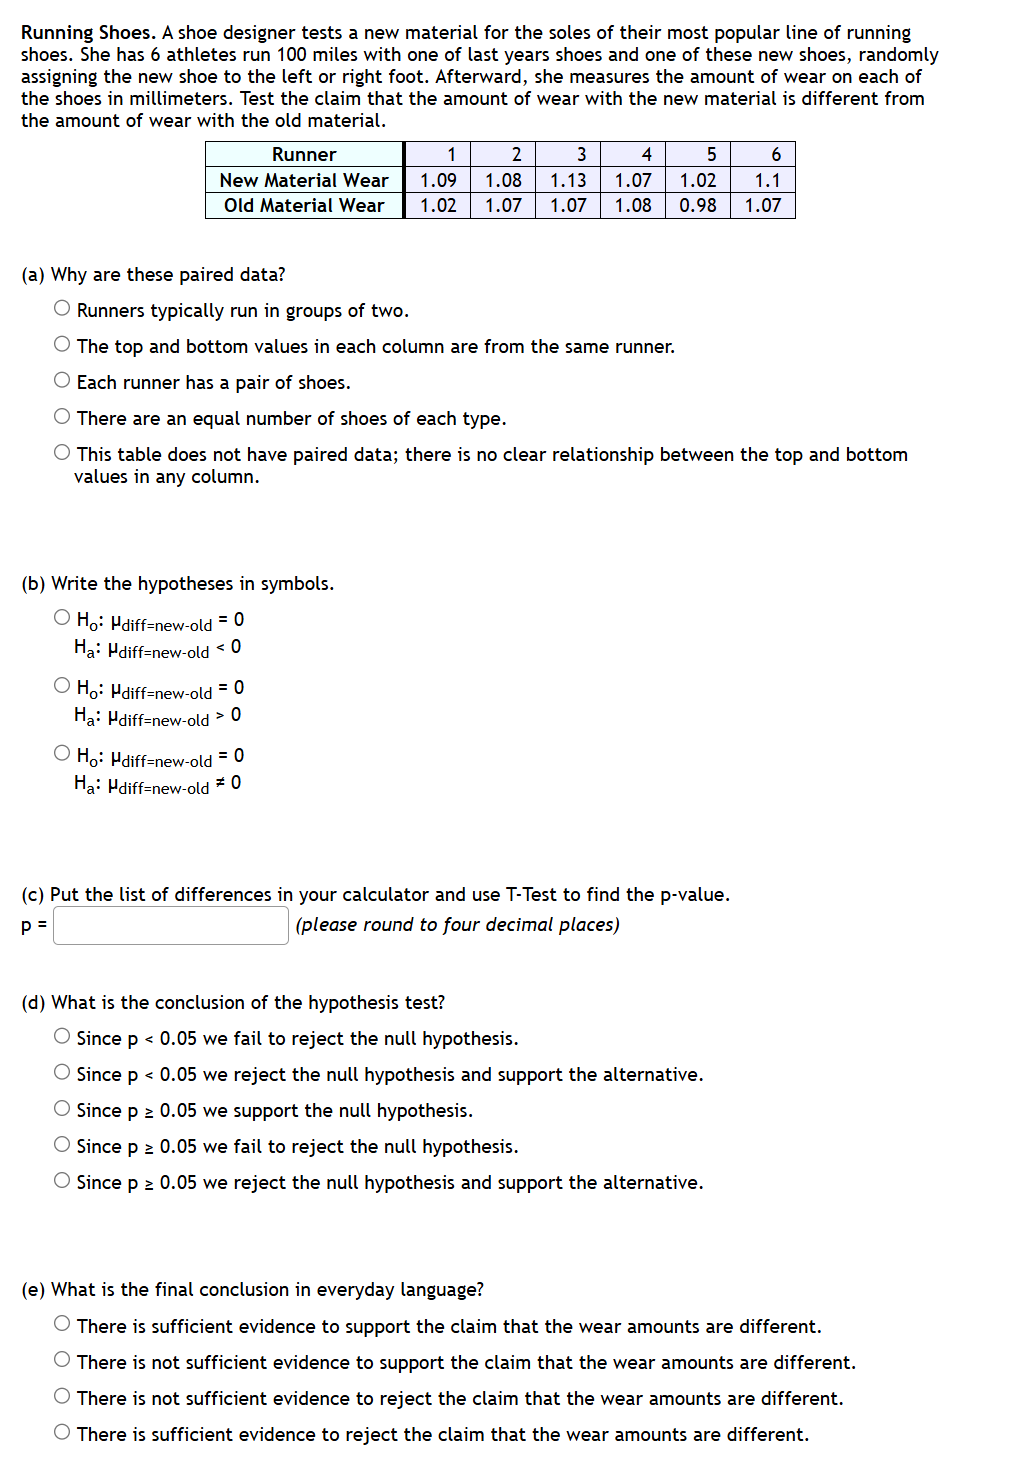
(Solved): Running Shoes. A shoe designer tests a new material for the soles of their most popular line of ru ...
Running Shoes. A shoe designer tests a new material for the soles of their most popular line of running shoes. She has 6 athletes run 100 miles with one of last years shoes and one of these new shoes, randomly assigning the new shoe to the left or right foot. Afterward, she measures the amount of wear on each of the shoes in millimeters. Test the claim that the amount of wear with the new material is different from the amount of wear with the old material. (a) Why are these paired data? Runners typically run in groups of two. The top and bottom values in each column are from the same runner. Each runner has a pair of shoes. There are an equal number of shoes of each type. This table does not have paired data; there is no clear relationship between the top and bottom values in any column. (b) Write the hypotheses in symbols.
H_(0):\mu _(diff )= new-old =0
H_(a):\mu _(diff )= new-old <0
H_(0):\mu _(diff )= new-old =0
H_(a):\mu _(diff )= new-old >0
H_(0):\mu _(diff )= new-old =0
H_(a):\mu _(diff )= new-old !=0
(c) Put the list of differences in your calculator and use T-Test to find the p-value.
p=(please round to four decimal places) (d) What is the conclusion of the hypothesis test? Since
p<0.05we fail to reject the null hypothesis. Since
p<0.05we reject the null hypothesis and support the alternative. Since
p>=0.05we support the null hypothesis. Since
P>=0.05we fail to reject the null hypothesis. Since
P>=0.05we reject the null hypothesis and support the alternative. (e) What is the final conclusion in everyday language? There is sufficient evidence to support the claim that the wear amounts are different. There is not sufficient evidence to support the claim that the wear amounts are different. There is not sufficient evidence to reject the claim that the wear amounts are different. There is sufficient evidence to reject the claim that the wear amounts are different.
