Home /
Expert Answers /
Economics /
refer-to-table-8-1-suppose-that-a-simple-economy-produces-only-four-goods-and-services-sweatshirt-pa744
(Solved): Refer to Table 8-1. Suppose that a simple economy produces only four goods and services: sweatshirt ...
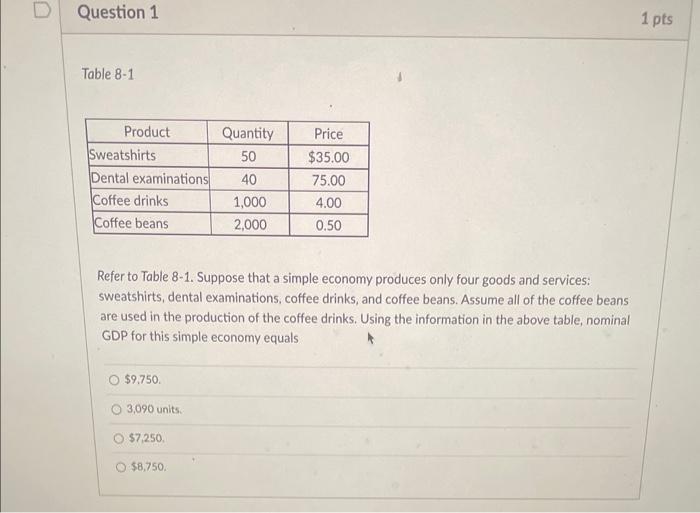
Refer to Table 8-1. Suppose that a simple economy produces only four goods and services: sweatshirts, dental examinations, coffee drinks, and coffee beans. Assume all of the coffee beans are used in the production of the coffee drinks. Using the information in the above table, nominal GDP for this simple economy equals \( \$ 9,750 \). 3,090 units. \( \$ 7,250 \). \( \$ 8,750 \).
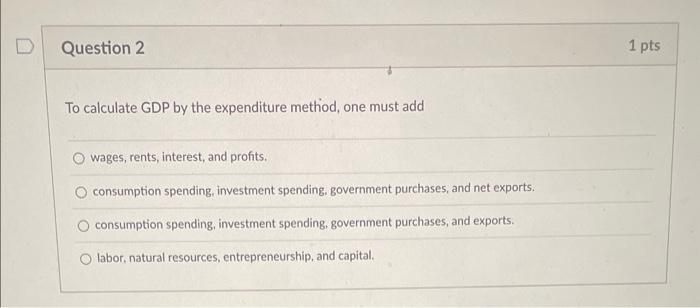
To calculate GDP by the expenditure method, one must add wages, rents, interest, and profits. consumption spending, investment spending, government purchases, and net exports. consumption spending, investment spending, government purchases, and exports. labor, natural resources, entrepreneurship, and capital.
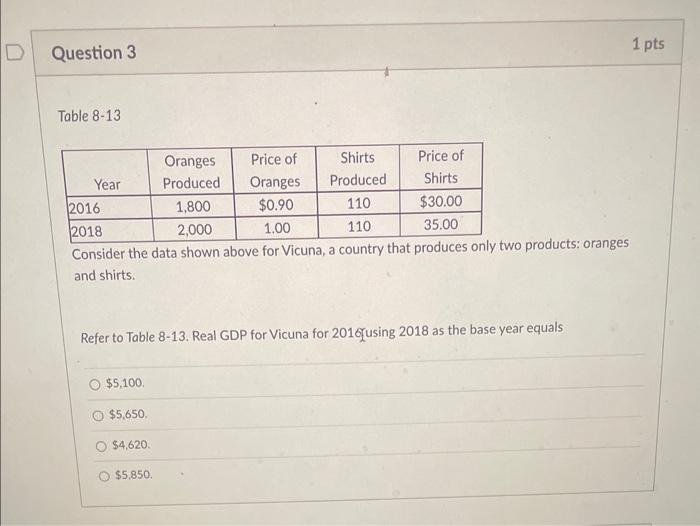
Table 8-13 Consider the data shown above for Vicuna, a country that proauces oniy two products: oranges and shirts. Refer to Table 8-13. Real GDP for Vicuna for 2016?using 2018 as the base year equals \[ \begin{array}{r} \$ 5,100 \\ \$ 5,650 \\ \$ 4,620 \\ \$ 5,850 \end{array} \]
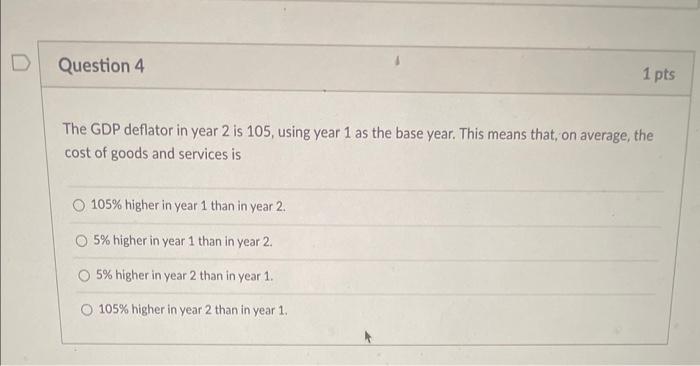
The GDP deflator in year 2 is 105 , using year 1 as the base year. This means that, on average, the cost of goods and services is \( 105 \% \) higher in year 1 than in year 2. \( 5 \% \) higher in year 1 than in year 2. \( 5 \% \) higher in year 2 than in year 1. \( 105 \% \) higher in year 2 than in year 1.
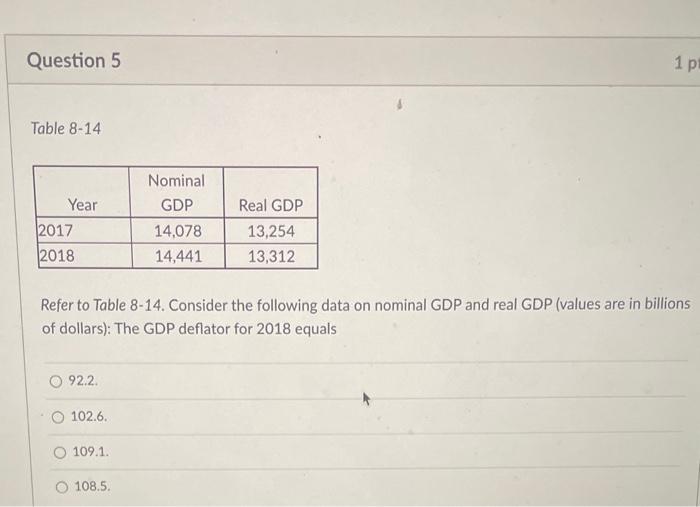
Table 8-14 Refer to Table 8-14. Consider the following data on nominal GDP and real GDP (values are in billions of dollars): The GDP deflator for 2018 equals \( 92.2 \). \( 102.6 \) \( 109.1 \) \( 108.5 \).
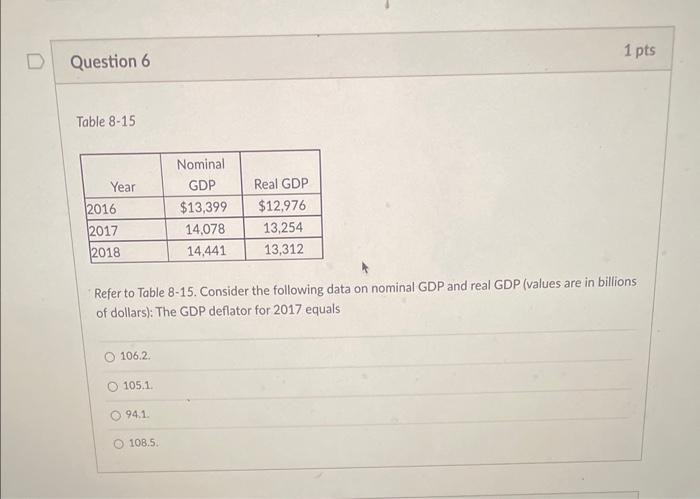
Table 8-15 Refer to Table 8-15. Consider the following data on nominal GDP and real GDP (values are in billions of dollars): The GDP deflator for 2017 equals 106.2. \( 105.1 \). \( 94.1 \). \( 108.5 \).
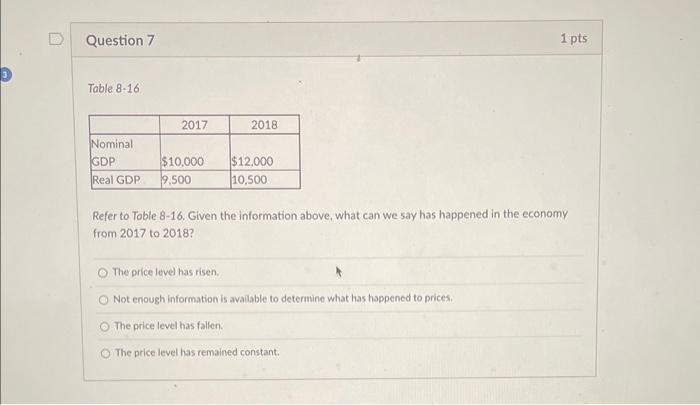
Question 7 Toble \( 8-16 \) Refer to Table 8-16. Given the information above, what can we say has happened in the economy from 2017 to \( 2018 ? \) The price level has risen. Not enough information is available to determine what has happened to prices, The price level has fallen. The price level has remained constant.
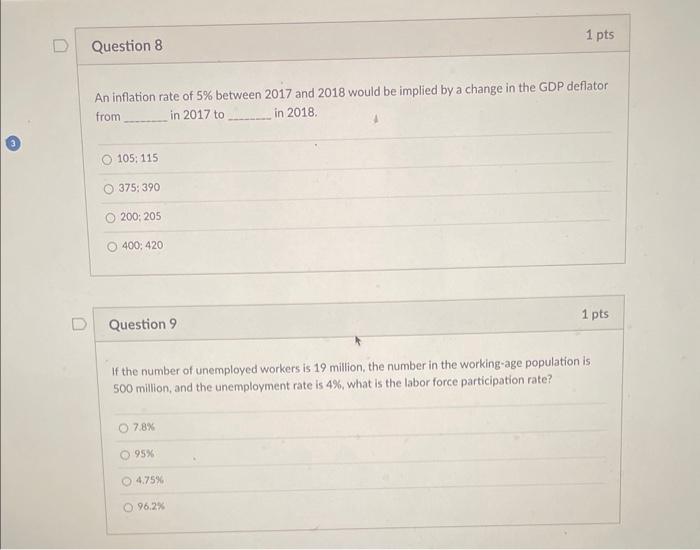
An inflation rate of \( 5 \% \) between 2017 and 2018 would be implied by a change in the GDP deflator from in 2017 to in 2018. \[ \begin{array}{|l|} \hline 105: 115 \\ \hline 375: 390 \\ \hline 200: 205 \\ \hline 400 ; 420 \\ \hline \end{array} \] Question 9 If the number of unemployed workers is 19 million, the number in the working-age population is 500 million, and the unemployment rate is \( 4 \% \), what is the labor force participation rate? \[ \begin{array}{|} \hline 7.8 \% \\ \hline 95 \% \\ \hline 4.75 \% \\ \hline 96.2 \% \\ \hline \end{array} \]
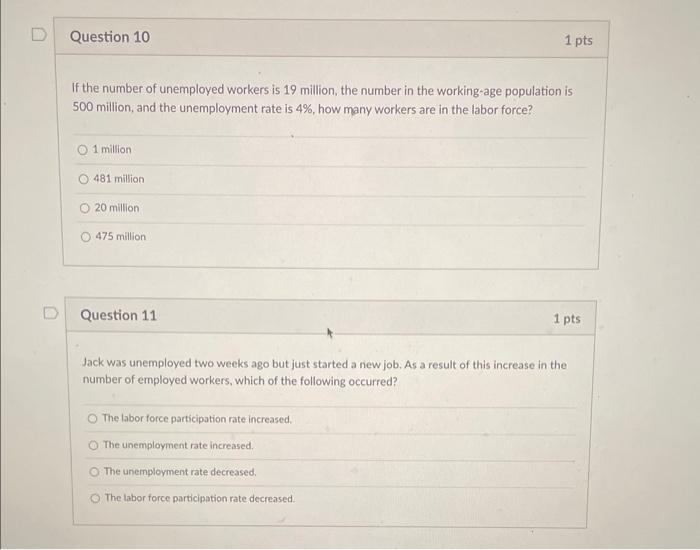
If the number of unemployed workers is 19 million, the number in the working-age population is 500 million, and the unemployment rate is \( 4 \% \), how many workers are in the labor force? 1 million 481 million 20 million 475 million Question 11 1 pts Jack was unemployed two weeks ago but just started a new job. As a result of this increase in the number of employed workers, which of the following occurred? The labor force participation rate increased. The unemployment rate increased. The unemployment rate decreased. The labor force participation rate decreased.
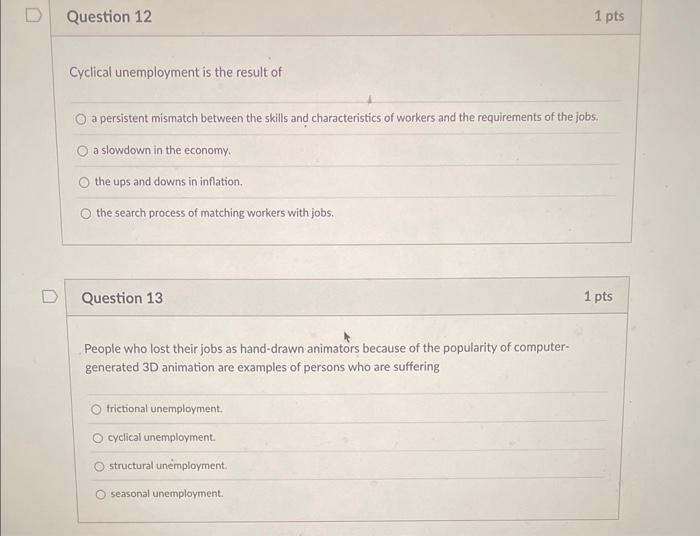
Cyclical unemployment is the result of a persistent mismatch between the skills and characteristics of workers and the requirements of the jobs. a slowdown in the economy. the ups and downs in inflation. the search process of matching workers with jobs. Question 13 1 pts People who lost their jobs as hand-drawn animators because of the popularity of computergenerated 3D animation are examples of persons who are suffering frictional unemployment. cyclical unemployment. structural unemployment. seasonal unemployment.
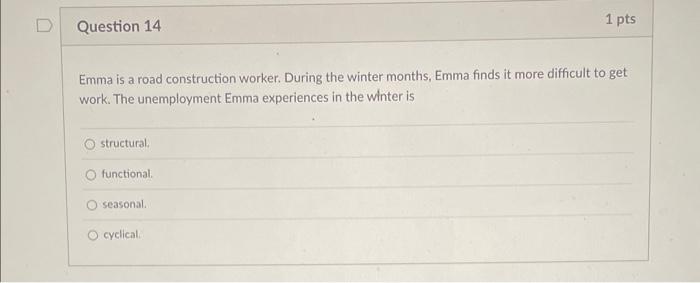
Emma is a road construction worker. During the winter months, Emma finds it more difficult to get work. The unemployment Emma experiences in the winter is structural. functional. seasonal. cyclical.
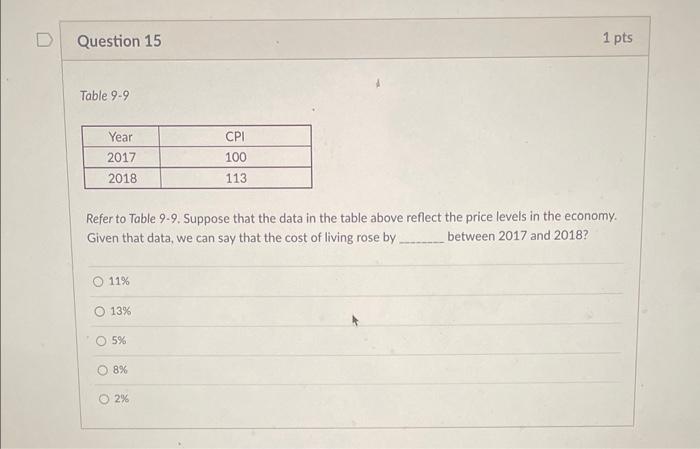
Refer to Table 9.9. Suppose that the data in the table above reflect the price levels in the economy. Given that data, we can say that the cost of living rose by between 2017 and 2018 ? \( 11 \% \) \( 13 \% \) \( 5 \% \) \( 8 \% \) \( 2 \% \)
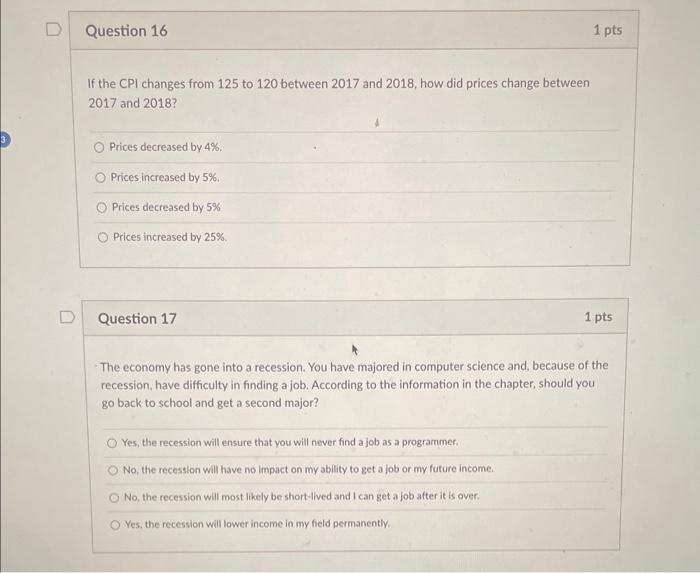
If the CPI changes from 125 to 120 between 2017 and 2018, how did prices change between 2017 and 2018? Prices decreased by \( 4 \% \), Prices increased by \( 5 \% \); Prices decreased by \( 5 \% \) Prices increased by \( 25 \% \). Question 17 1 pts The economy has gone into a recession. You have majored in computer science and, because of the recession, have difficulty in finding a job. According to the information in the chapter, should you go back to school and get a second major? Yes, the recession will ensure that you will never find a job as a programmer. No, the recession will have no impact on my ability to get a job or my future income. No, the recession will most likely be short-lived and I can get a job after it is over. Yes, the recession will lower income in my field permanently.
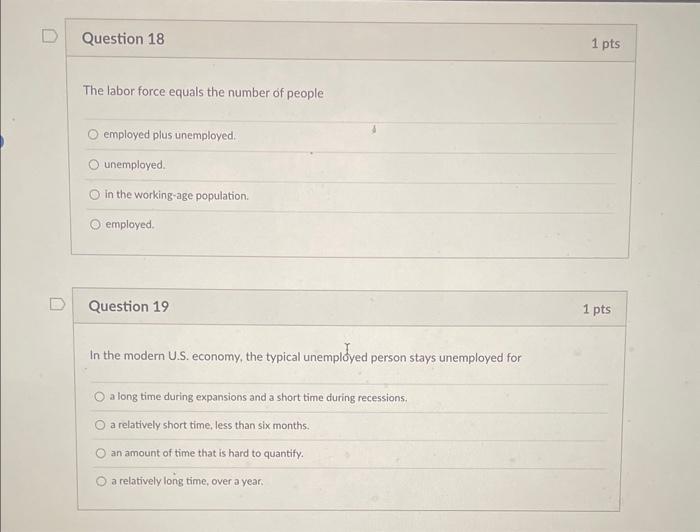
The labor force equals the number of people employed plus unemployed. unemployed. in the working-age population. employed. Question 19 In the modern U.S. economy, the typical unemployed person stays unemployed for a long time during expansions and a short time during recessions. a relatively short time, less than six months. an amount of time that is hard to quantify. a relatively long time, over a year.
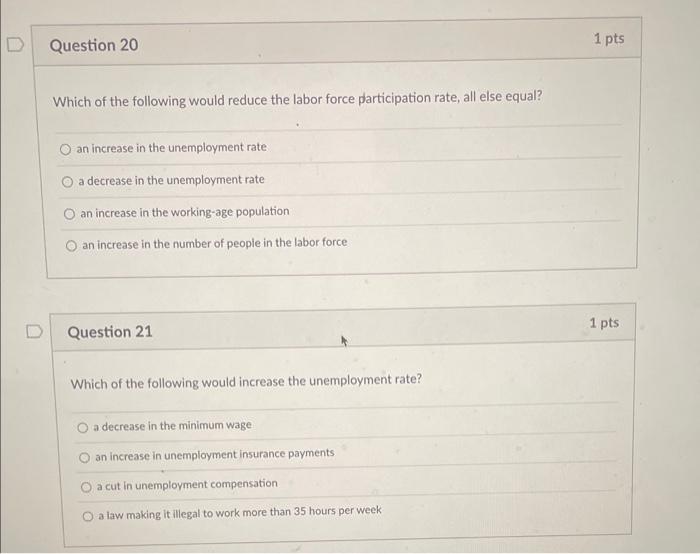
Which of the following would reduce the labor force participation rate, all else equal? an increase in the unemployment rate a decrease in the unemployment rate an increase in the working-age population an increase in the number of people in the labor force Question 21 Which of the following would increase the unemployment rate? a decrease in the minimum wage an increase in unemployment insurance payments a cut in unemployment compensation a law making it illegal to work more than 35 hours per week
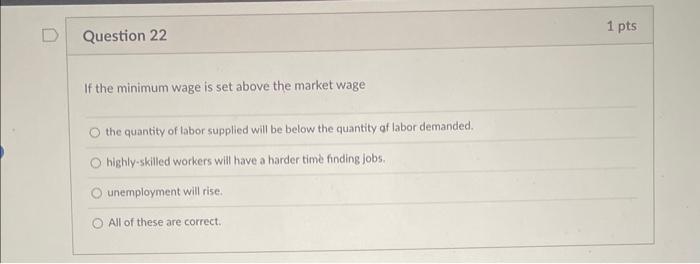
If the minimum wage is set above the market wage the quantity of labor supplied will be below the quantity af labor demanded. highly-skilled workers will have a harder time finding jobs. unemployment will rise. All of these are correct.
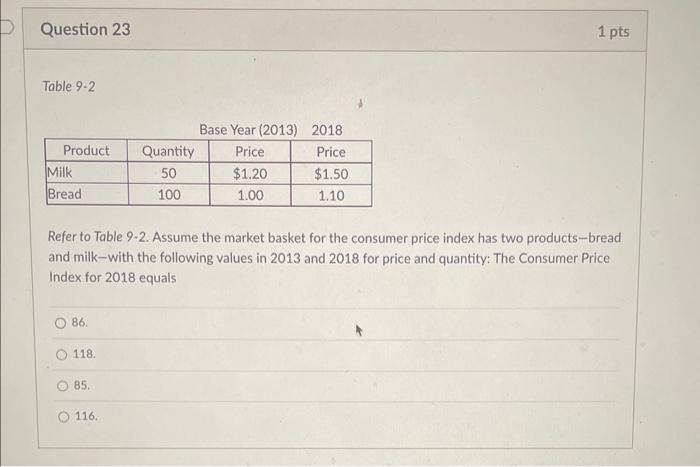
Table 9-2 Base Year (2013) 2018 Refer to Table 9-2. Assume the market basket for the consumer price index has two products-bread and milk-with the following values in 2013 and 2018 for price and quantity: The Consumer Price Index for 2018 equals 86. 118. 85. 116.
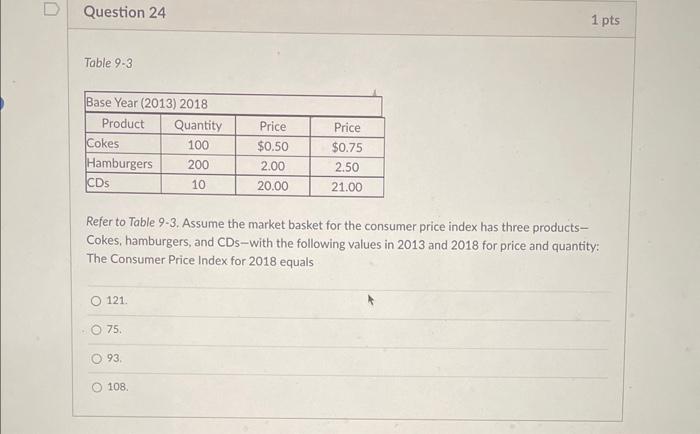
Table 9-3 Refer to Table 9-3. Assume the market basket for the consumer price index has three productsCokes, hamburgers, and CDs-with the following values in 2013 and 2018 for price and quantity: The Consumer Price Index for 2018 equals 121. 75. 93. 108.
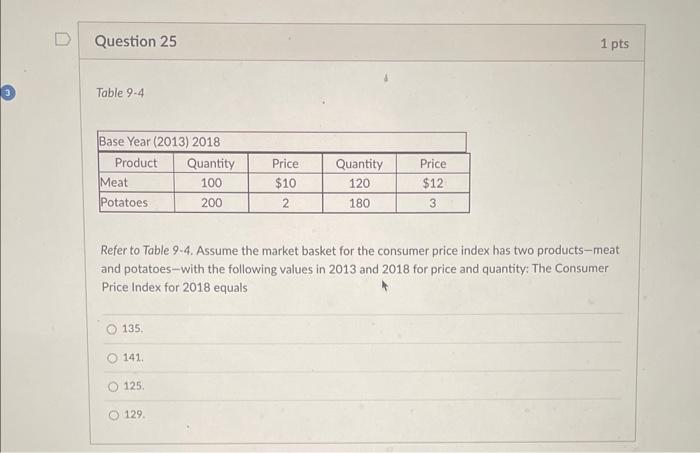
Table 9-4 Refer to Table 9-4. Assume the market basket for the consumer price index has two products-meat and potatoes-with the following values in 2013 and 2018 for price and quantity: The Consumer Price Index for 2018 equals 135. 141. 125. 129.
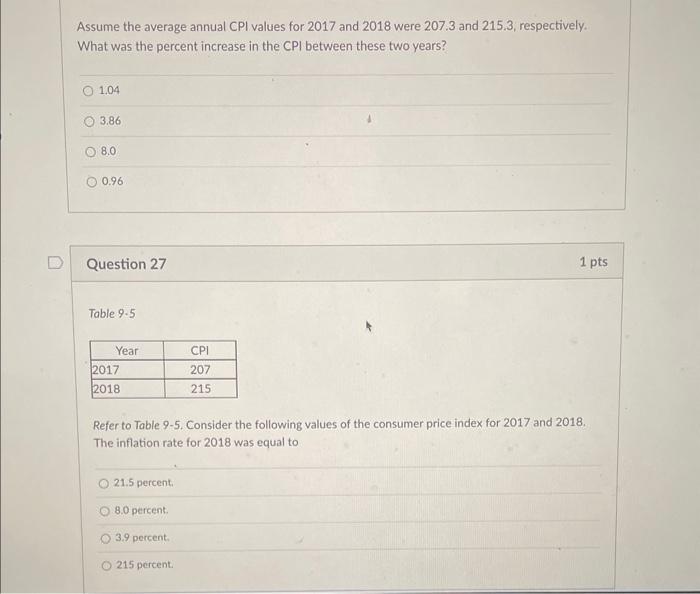
Assume the average annual CPI values for 2017 and 2018 were \( 207.3 \) and 215.3, respectively. What was the percent increase in the CPI between these two years? \begin{tabular}{|r|} \hline \( 1.04 \) \\ \hline \( 3.86 \) \\ \hline \( 8.0 \) \\ \hline \( 0.96 \) \\ \hline \end{tabular} Question 27 1 pts Table \( 9 \cdot 5 \) Refer to Table 9-5. Consider the following values of the consumer price index for 2017 and 2018. The inflation rate for 2018 was equal to \( 21.5 \) percent, \( 8.0 \) percent. \( 3.9 \) percent. 215 percent.
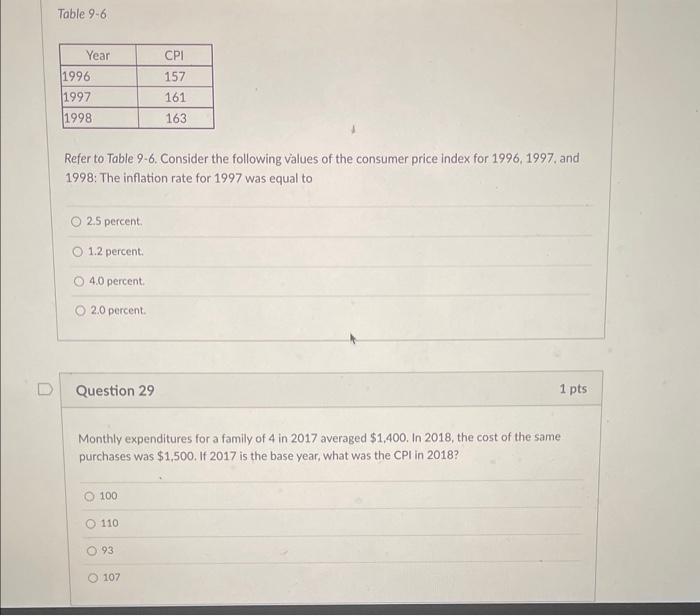
Table 9-6 Refer to Table 9-6. Consider the following values of the consumer price index for 1996 , 1997, and 1998: The inflation rate for 1997 was equal to \( 2.5 \) percent: \( 1.2 \) percent. \( 4.0 \) percent. \( 2.0 \) percent. Question 29 1 pts Monthly expenditures for a family of 4 in 2017 averaged \$1,400. In 2018, the cost of the same purchases was \( \$ 1,500 \). If 2017 is the base year, what was the CPI in 2018? 100 110 93 107
During the month of May, 10 million workers moved from being classified as "unemployed" to being classified as "employed." As a result the unemployment rate rose. the labor force participation rate fell. the unemployment rate fell. the labor force participation rate rose.
Expert Answer
Towards the first independent question no. 1: The key point to note and take care here is that since coffee beans are fully used as i