Home /
Expert Answers /
Advanced Math /
question-t2-q12-12-11-7-figure-3-figure-3-is-a-graph-of-the-trajectory-of-a-golf-ball-after-the-b-pa571
(Solved): Question T2 Q12 12. 11 7 Figure 3 Figure 3 is a graph of the trajectory of a golf ball after the b ...
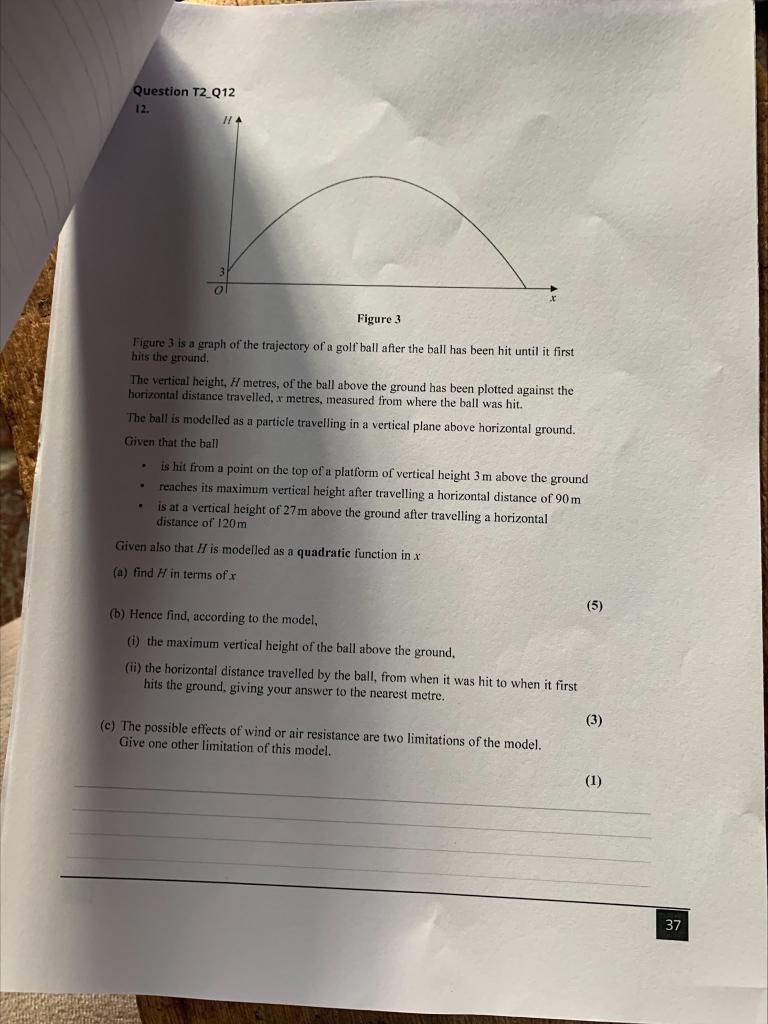
Question T2 Q12 12. 11 7 Figure 3 Figure 3 is a graph of the trajectory of a golf ball after the ball has been hit until it first hits the ground. The vertical height, H metres, of the ball above the ground has been plotted against the horizontal distance travelled, x metres, measured from where the ball was hit. The ball is modelled as a particle travelling in a vertical plane above horizontal ground. Given that the ball . is hit from a point on the top of a platform of vertical height 3 m above the ground reaches its maximum vertical height after travelling a horizontal distance of 90 m . is at a vertical height of 27 m above the ground after travelling a horizontal distance of 120m Given also that H is modelled as a quadratic function in x (a) find H in terms of x (5) (b) Hence find, according to the model, (i) the maximum vertical height of the ball above the ground, (ii) the horizontal distance travelled by the ball, from when it was hit to when it first. hits the ground, giving your answer to the nearest metre. (3) (c) The possible effects of wind or air resistance are two limitations of the model. Give one other limitation of this model. (1) 37