Home /
Expert Answers /
Economics /
question-1-the-following-diagram-shows-the-lrac-and-mc-curves-for-a-natural-monopoly-long-run-avera-pa679
(Solved): Question 1 The following diagram shows the LRAC and MC curves for a natural monopoly-long-run avera ...
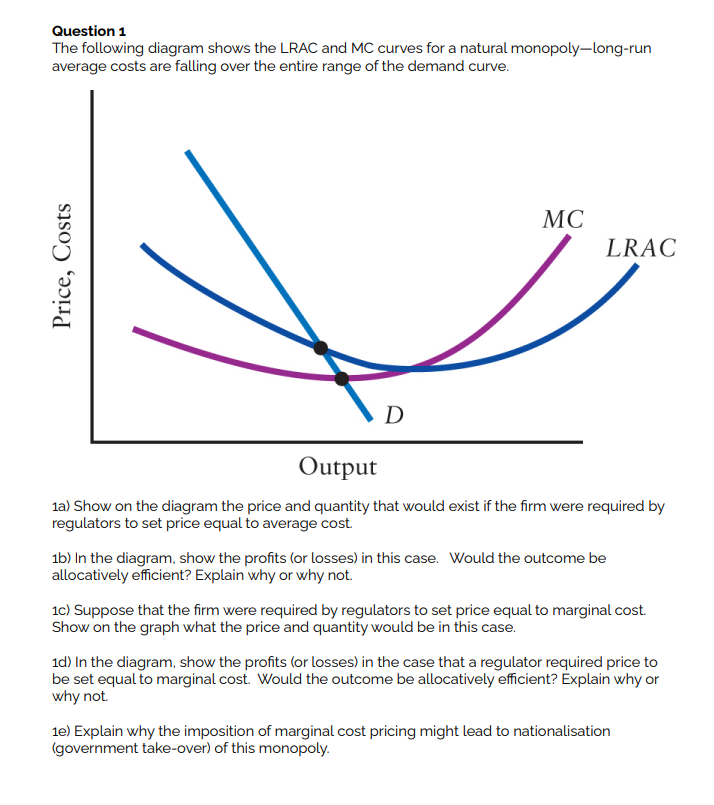
Question 1 The following diagram shows the LRAC and MC curves for a natural monopoly-long-run average costs are falling over the entire range of the demand curve. 1a) Show on the diagram the price and quantity that would exist if the firm were required by regulators to set price equal to average cost. 1b) In the diagram, show the profits (or losses) in this case. Would the outcome be allocatively efficient? Explain why or why not. 1c) Suppose that the firm were required by regulators to set price equal to marginal cost. Show on the graph what the price and quantity would be in this case. 1d) In the diagram, show the profits (or losses) in the case that a regulator required price to be set equal to marginal cost. Would the outcome be allocatively efficient? Explain why or why not. 1e) Explain why the imposition of marginal cost pricing might lead to nationalisation (government take-over) of this monopoly.
Expert Answer
Step 1: Define average total cost and marginal cost...