Home /
Expert Answers /
Electrical Engineering /
q13-based-on-the-figure-1-below-by-using-the-single-tone-modulating-signal-cos-omega-m-t-i-v-pa544
(Solved): Q13. Based on the Figure 1 below, by using the single tone modulating signal cos\omega _(m)t : (i) V ...
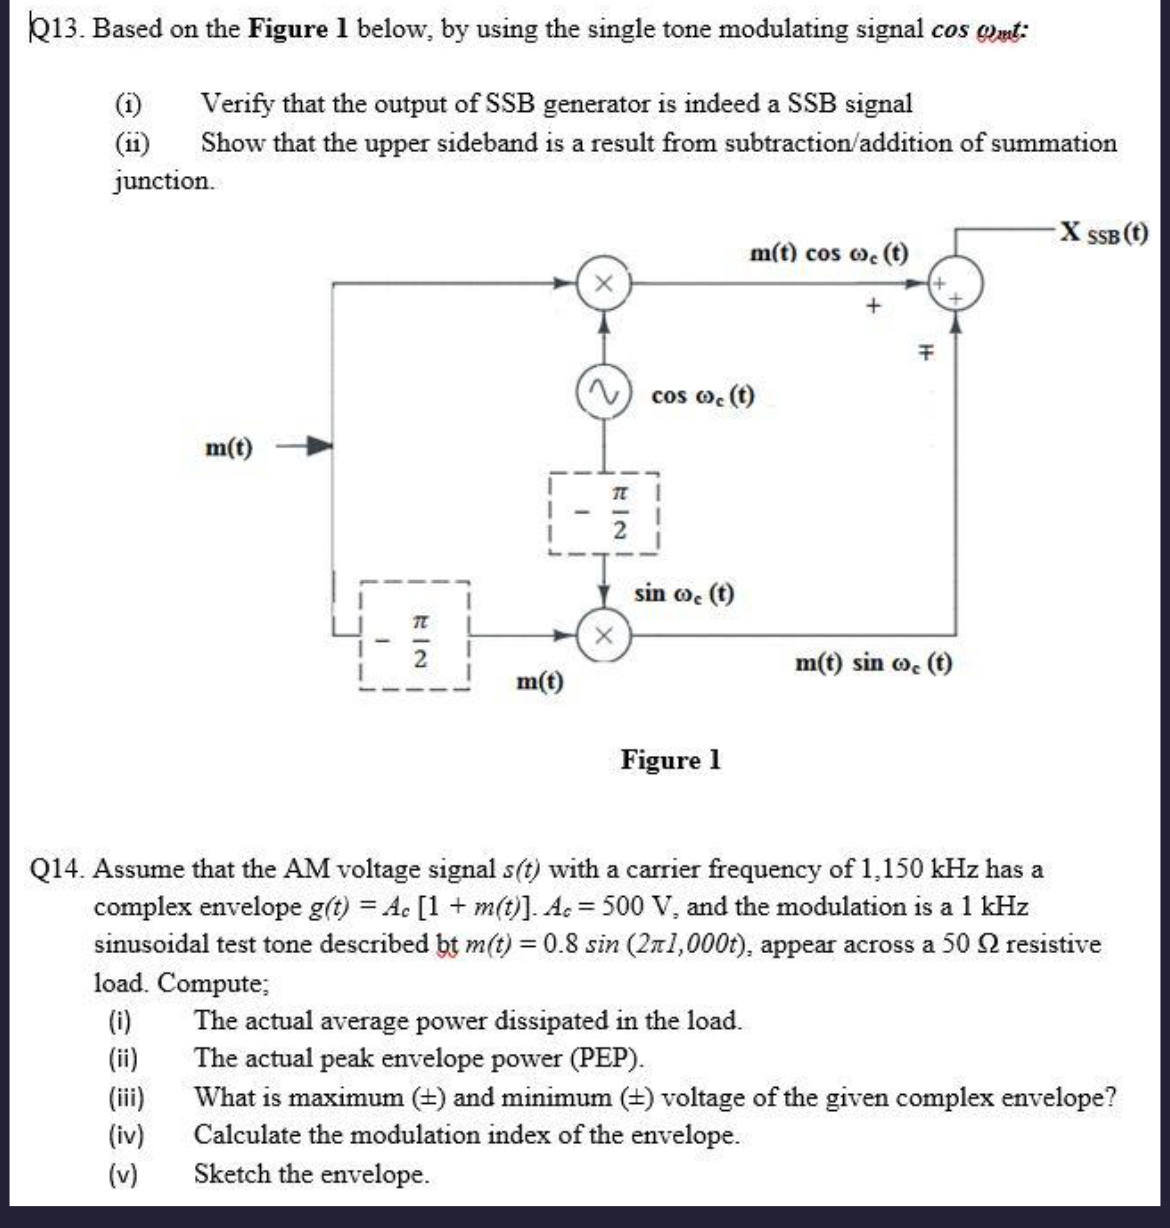
Q13. Based on the Figure
1below, by using the single tone modulating signal
cos\omega _(m)t: (i) Verify that the output of SSB generator is indeed a SSB signal (ii) Show that the upper sideband is a result from subtraction/addition of summation junction. Figure 1 Q14. Assume that the AM voltage signal
s(t)with a carrier frequency of
1,150kHzhas a complex envelope
g(t)=A_(c)[1+m(t)].A_(c)=500V, and the modulation is a 1 kHz sinusoidal test tone described bt
m(t)=0.8sin(2\pi l,000t), appear across a
50\Omega resistive load. Compute; (i) The actual average power dissipated in the load. (ii) The actual peak envelope power (PEP). (iii) What is maximum (
+-) and minimum (
+-) voltage of the given complex envelope? (iv) Calculate the modulation index of the envelope. (v) Sketch the envelope.