Home /
Expert Answers /
Electrical Engineering /
procedure-build-the-circuit-shown-in-fig-1-the-source-voltage-is-the-function-generator-set-to-pro-pa288
(Solved): Procedure Build the circuit shown in Fig 1. The source voltage is the function generator set to pro ...
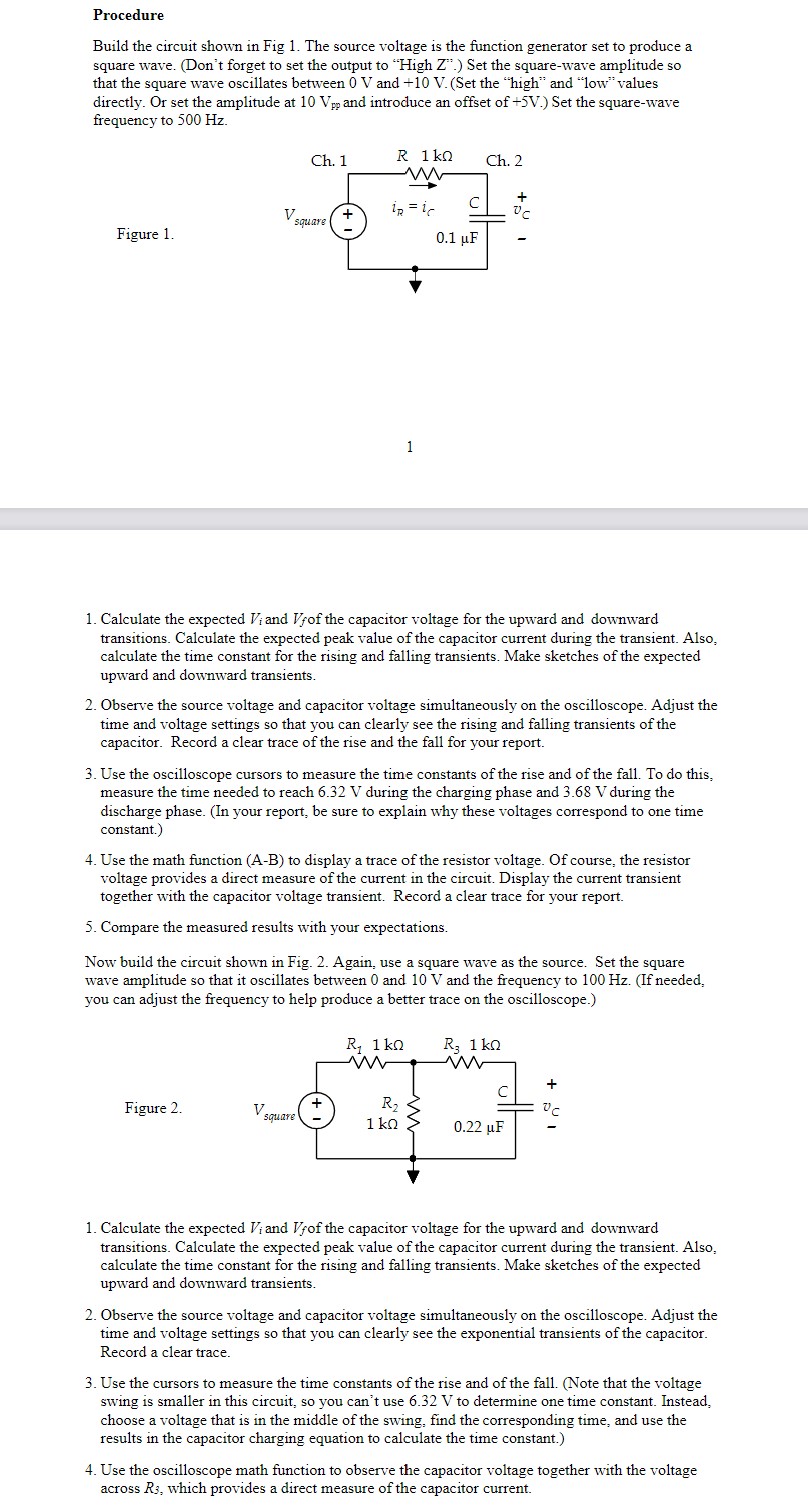
Procedure Build the circuit shown in Fig 1. The source voltage is the function generator set to produce a square wave. (Don't forget to set the output to "High Z".) Set the square-wave amplitude so that the square wave oscillates between and . (Set the "high" and "low" values directly. Or set the amplitude at and introduce an offset of .) Set the square-wave frequency to . Figure 1. 1 1. Calculate the expected and of the capacitor voltage for the upward and downward transitions. Calculate the expected peak value of the capacitor current during the transient. Also, calculate the time constant for the rising and falling transients. Make sketches of the expected upward and downward transients. 2. Observe the source voltage and capacitor voltage simultaneously on the oscilloscope. Adjust the time and voltage settings so that you can clearly see the rising and falling transients of the capacitor. Record a clear trace of the rise and the fall for your report. 3. Use the oscilloscope cursors to measure the time constants of the rise and of the fall. To do this, measure the time needed to reach during the charging phase and during the discharge phase. (In your report, be sure to explain why these voltages correspond to one time constant.) 4. Use the math function (A-B) to display a trace of the resistor voltage. Of course, the resistor voltage provides a direct measure of the current in the circuit. Display the current transient together with the capacitor voltage transient. Record a clear trace for your report. 5. Compare the measured results with your expectations. Now build the circuit shown in Fig. 2. Again, use a square wave as the source. Set the square wave amplitude so that it oscillates between 0 and and the frequency to . (If needed, you can adjust the frequency to help produce a better trace on the oscilloscope.) Figure 2. 1. Calculate the expected and of the capacitor voltage for the upward and downward transitions. Calculate the expected peak value of the capacitor current during the transient. Also, calculate the time constant for the rising and falling transients. Make sketches of the expected upward and downward transients. 2. Observe the source voltage and capacitor voltage simultaneously on the oscilloscope. Adjust the time and voltage settings so that you can clearly see the exponential transients of the capacitor. Record a clear trace. 3. Use the cursors to measure the time constants of the rise and of the fall. (Note that the voltage swing is smaller in this circuit, so you can't use to determine one time constant. Instead, choose a voltage that is in the middle of the swing, find the corresponding time, and use the results in the capacitor charging equation to calculate the time constant.) 4. Use the oscilloscope math function to observe the capacitor voltage together with the voltage across , which provides a direct measure of the capacitor current.
Expert Answer
1. Source voltage is Square waveIn the interval Vi=0V